
What are histograms, and how are they used to represent data? Explain Binomial Distribution
SOLUTION....
1. Histograms
Definition
A histogram is a graphical way of representing the distribution of numerical data. It looks similar to a bar chart, but unlike bar charts (which represent categories), histograms are used to represent continuous or large numerical data that has been divided into intervals (called bins or classes).
How a Histogram is Constructed
Divide the data range into intervals (bins).
Example: If exam marks range from 0–100, bins could be 0–10, 11–20, 21–30, …, 91–100.Count the frequency of data values that fall into each bin.
Example: If 8 students scored between 21–30, the frequency for that bin is 8.Draw rectangles for each bin:
X-axis = intervals (bins).
Y-axis = frequency (count of observations in that interval).
The height of each bar represents the frequency.
Example
Suppose marks of 20 students in an exam are:15, 22, 25, 30, 32, 35, 37, 40, 42, 43, 45, 47, 50, 53, 55, 57, 60, 62, 65, 70
If we make intervals of width 10 (10–20, 21–30, 31–40, etc.):
10–20 → 1 student
21–30 → 3 students
31–40 → 3 students
41–50 → 5 students
51–60 → 4 students
61–70 → 4 students
Now, plotting these as a histogram will give a visual picture of how marks are distributed.
Uses of Histograms
To understand shape of data distribution (e.g., normal, skewed).
To identify central tendency (where most values lie).
To detect spread of data (range and variation).
To spot outliers (extremely high or low values).
2. Binomial Distribution
Definition
A Binomial Distribution is a probability distribution that summarizes the likelihood of a certain number of successes in a fixed number of independent experiments (trials), where each trial has only two possible outcomes: success or failure.
It is one of the most widely used discrete probability distributions in statistics.
Conditions for a Binomial Distribution
For a random variable to follow binomial distribution:
Fixed number of trials (n): The experiment is repeated a specific number of times.
Two outcomes per trial: Each trial can result in either success (S) or failure (F).
Constant probability (p): The probability of success remains the same for every trial.
Independence: The outcome of one trial does not affect another.
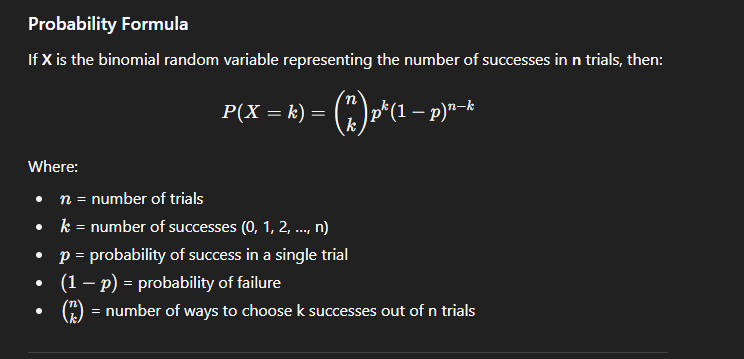
Probability Formula
If X is the binomial random variable representing the number of successes in n trials, then:
Example
Suppose we toss a fair coin 5 times. Let success = getting a Head.
n=5n = 5n=5
p=0.5p = 0.5p=0.5
q=1−p=0.5q = 1-p = 0.5q=1−p=0.5
Find the probability of getting exactly 3 heads.

Properties of Binomial Distribution
Mean: μ=n⋅p\mu = n \cdot pμ=n⋅p
Variance: σ2=n⋅p⋅(1−p)\sigma^2 = n \cdot p \cdot (1-p)σ2=n⋅p⋅(1−p)
Shape:
If p=0.5p = 0.5p=0.5, the distribution is symmetric.
If p<0.5p < 0.5p<0.5, it is skewed to the right.
If p>0.5p > 0.5p>0.5, it is skewed to the left.
Real-Life Applications
Quality control: Probability of defective items in a batch.
Marketing: Probability of customers buying a product.
Medicine: Probability of patients recovering from a treatment.
Sports: Probability of a player hitting a target in fixed attempts.