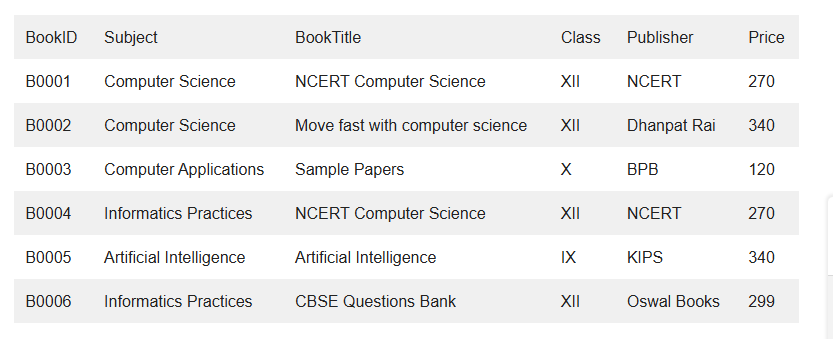
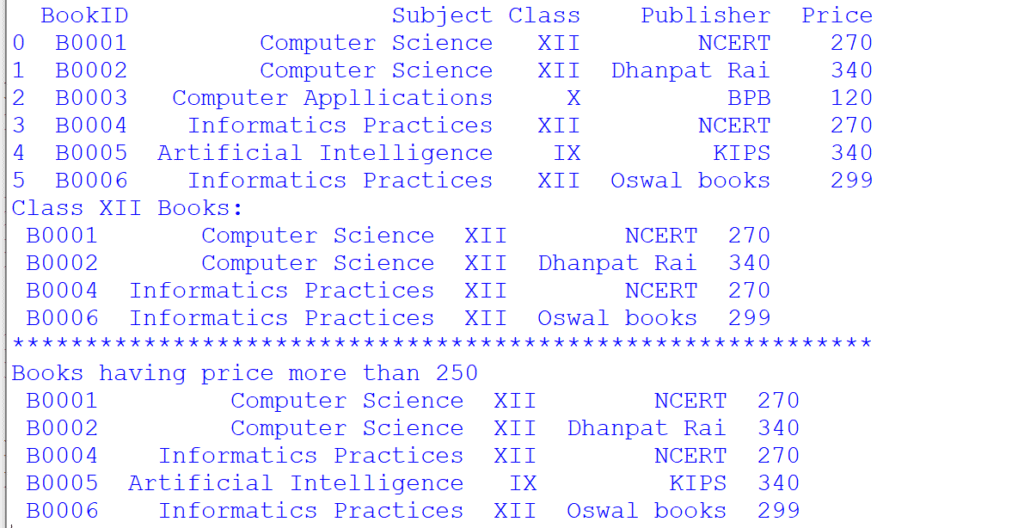
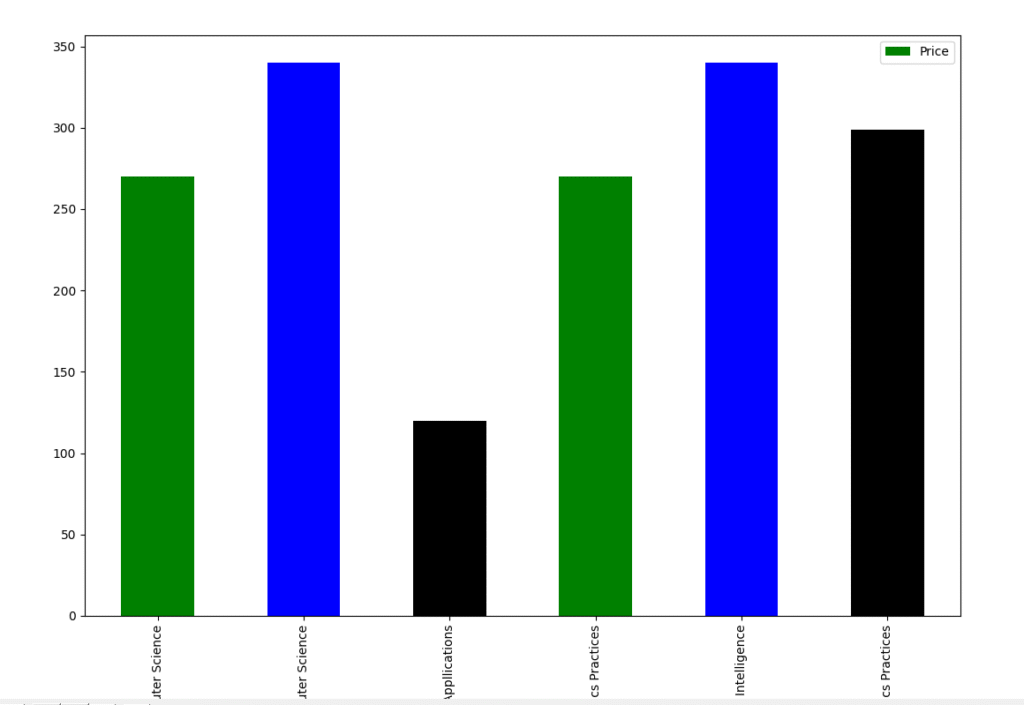
import pandas as pd
import matplotlib.pyplot as plt
#Answer 1
data={'BookID':['B0001','B0002','B0003','B0004','B0005','B0006'],\
      'Subject':['Computer Science','Computer Science','Computer Appllications',\
      'Informatics Practices','Artificial Intelligence','Informatics Practices'],\
      'Class':['XII','XII','X','XII','IX','XII'],\
      'Publisher':['NCERT','Dhanpat Rai','BPB','NCERT','KIPS','Oswal books'],\
      'Price':[270,340,120,270,340,299]}
books=pd.DataFrame(data)
print(books)

#Asnwer 2
print("Class XII Books:")
print(books[books['Class']=='XII'].to_string(header=False,index=False))
print("***********************************************************")

#Asnwer 3
print("Books having price more than 250")
print(books[books['Price']>250].to_string(header=False,index=False))

#Answer 4
books.plot(x='Subject',y='Price',kind='bar',color=["green","blue","black"])
plt.show()
Your email address will not be published. Required fields are marked *
Comment *
Name *
Email *
Website
Save my name, email, and website in this browser for the next time I comment.
© Copyright CODEMANIAC STUDIO ™