
Day-1 Introduction to PowerBI
Introduction to Power BI.
Power BI is a powerful Business Intelligence (BI) and data visualization tool developed by Microsoft. It helps users analyze data, create interactive dashboards, and generate insightful reports with ease
What is Power BI?
Power BI is a collection of software services, apps, and connectors that work together to transform raw data into meaningful insights.
It allows users to connect to various data sources, clean and transform data, visualize insights, and share reports within an organization.
🔹 Key Features of Power BI:
Data Connectivity: Connects to multiple data sources (Excel, SQL Server, cloud databases, web APIs, etc.).
Data Transformation: Clean, model, and prepare data using Power Query.
Data Visualization: Create interactive dashboards and reports with charts, graphs, and tables.
AI-Powered Insights: Uses machine learning and AI to detect patterns and trends.
Cloud & Collaboration: Share reports via Power BI Service and collaborate in real time.
Security & Governance: Ensures data security with role-based access control.
Power BI Components
Power BI consists of three major components:
Power BI Desktop
A Windows application used to create reports and dashboards.
Offers powerful data modeling and visualization tools.
Power BI Service (Cloud-based)
A web-based platform for publishing and sharing reports.
Enables collaboration and cloud-based analytics.
Power BI Mobile
Available for iOS and Android devices.
Allows users to view reports on the go.
Power BI Architecture Diagram
Below is a simplified architecture of Power BI, showing how data flows from different sources into Power BI and is transformed into reports and dashboards.
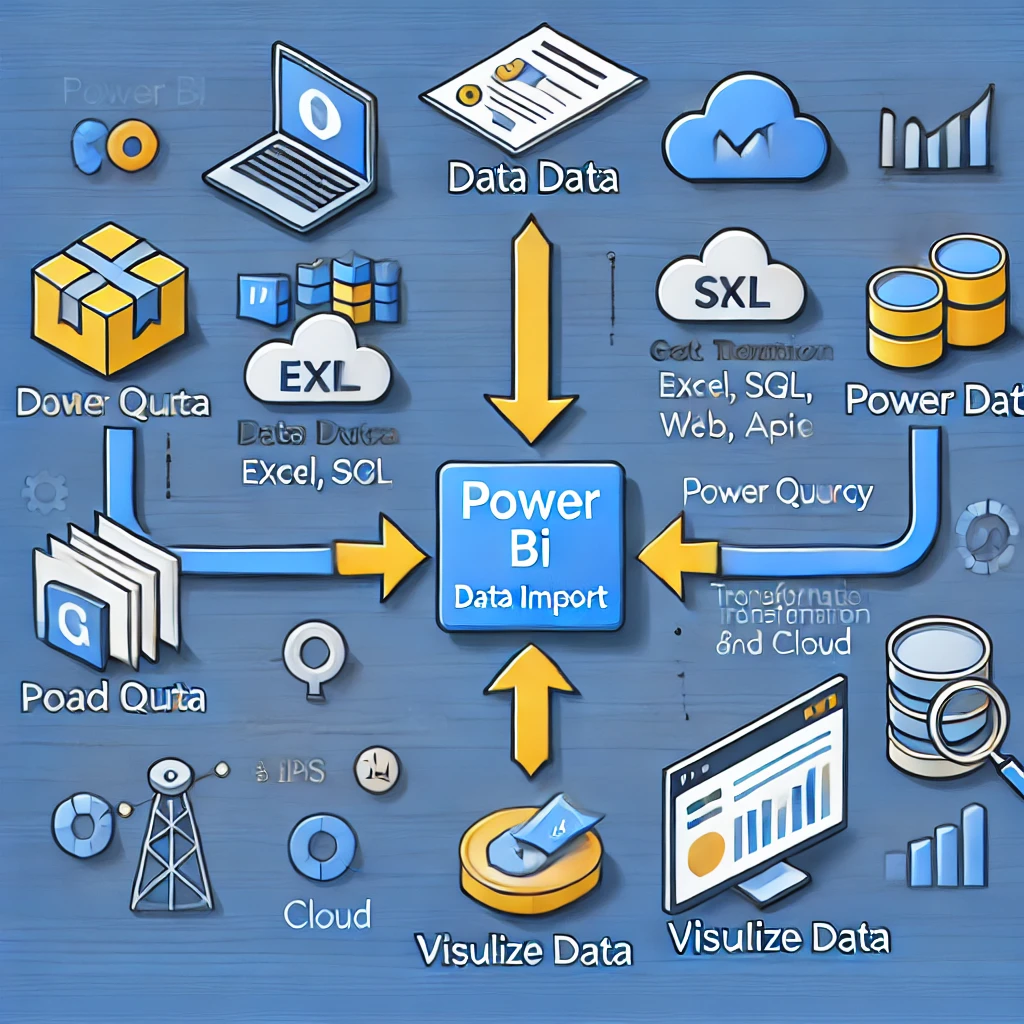
Power BI Workflow
1. Connecting to Data Sources
Power BI supports multiple data sources:
Files: Excel, CSV, XML, JSON
Databases: SQL Server, MySQL, PostgreSQL
Cloud Services: Google Analytics, Azure, AWS, SharePoint
APIs and Online Services: Salesforce, Facebook, Power Apps
💡 Power BI allows both online and offline data connectivity.
2. Data Transformation (Power Query)
Power Query is used to clean and transform raw data before visualization. It includes:
Removing duplicates
Filtering data
Merging datasets
Creating calculated columns
3. Data Modeling & DAX (Data Analysis Expressions)
Data Modeling: Define relationships between tables (like in a database).
DAX (Data Analysis Expressions): A formula language to create calculated columns, measures, and custom aggregations.
Total Sales = SUM(Sales[Amount])
4. Data Visualization
Power BI provides various charts and visualizations, such as:
Bar & Column Charts
Line & Area Charts
Pie Charts & Donut Charts
Maps (Geospatial Data)
Tables & Matrices
KPI Cards & Gauge Charts
💡 Best Practices for Visualizations:
✅ Use the right chart type for the data
✅ Keep dashboards clean and easy to read
✅ Use filters and slicers for interactive reports
5. Publishing & Sharing Reports
Power BI Service (Cloud) allows users to publish reports and collaborate.
Reports can be shared via email, Teams, SharePoint, or embedded in apps.
Power BI Gateways enable secure on-premises data access.
Power BI vs Other BI Tools.
| Feature | Power BI | Tableau | Google Data Studio |
|---|---|---|---|
| Ease of Use | ✅ Easy | Moderate | Moderate |
| Integration | ✅ Strong (Excel, SQL, Azure) | Good | Limited |
| AI/ML Support | ✅ Yes | Yes | No |
| Pricing | ✅ Affordable | Expensive | Free |
| Cloud Support | ✅ Yes | Yes | Yes |