
Introduction to Power BI

Introduction to Power BI.
Power BI is a powerful business analytics tool developed by Microsoft.
It allows users to visualize data, share insights, and make informed decisions based on real-time information.
With Power BI, businesses can connect to various data sources, transform raw data into meaningful insights, and present it in the form of interactive dashboards and reports.
What is Power BI?
Power BI is a suite of business intelligence tools that helps in:
Data Collection – Importing data from a variety of sources.
Data Transformation – Cleaning and reshaping the data using Power Query.
Data Modeling – Establishing relationships between data tables and creating measures and calculations.
Data Visualization – Building reports and dashboards using visuals like charts, maps, and tables.
Data Sharing – Publishing reports to the Power BI service and sharing them with others.
Components of Power BI
Power BI consists of several key components:
Power BI Desktop
A free application for Windows that allows users to design and build reports and data models. It is used for report creation and data analysis.Power BI Service (PowerBI.com)
A cloud-based platform where reports can be published, shared, and accessed online.Power BI Mobile
Apps available for Android and iOS to access and interact with reports on the go.Power BI Gateway
A bridge that allows secure data transfer between on-premises data sources and Power BI services.Power BI Report Server
An on-premises solution for hosting and managing Power BI reports behind your organization’s firewall.Power Query
A data connection technology that enables you to discover, connect, combine, and refine data.
Why Use Power BI?
Power BI is popular because it:
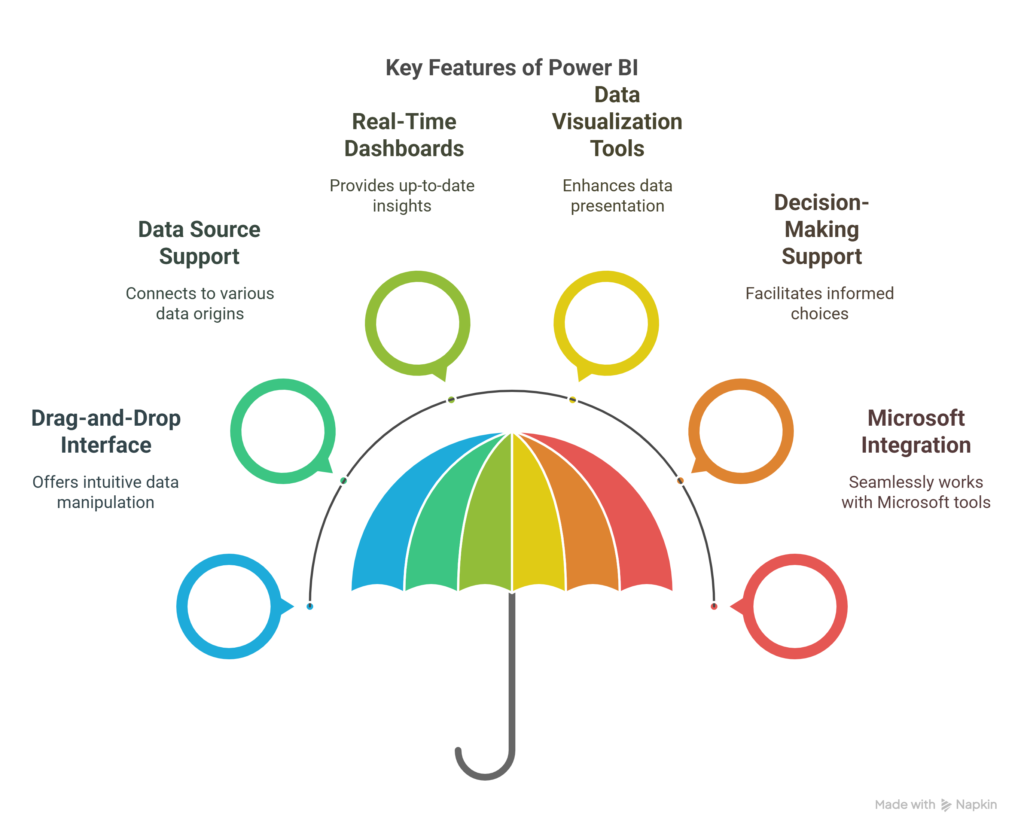
Offers easy-to-use drag-and-drop features.
Supports a wide range of data sources (Excel, SQL Server, SharePoint, cloud services, etc.).
Enables real-time dashboards and reports.
Provides rich data visualization tools.
Allows data-driven decision-making.
Integrates with Microsoft tools like Excel, Azure, and Teams.
Common Use Cases
Benefits of Power BI.
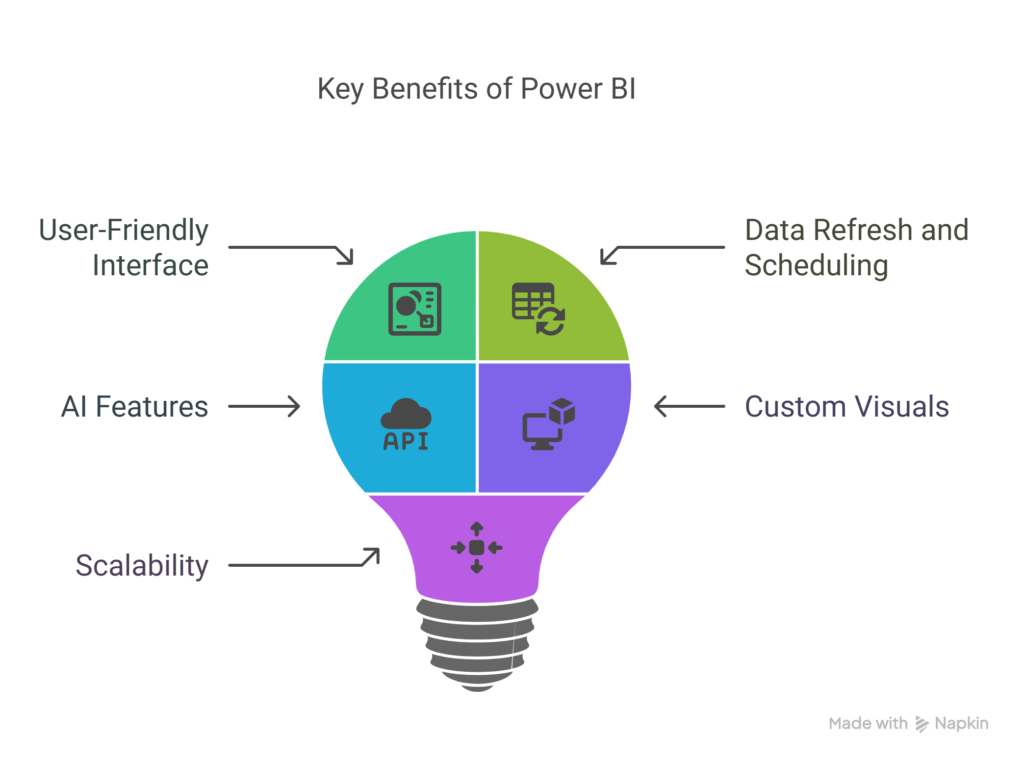
User-Friendly Interface – Even non-technical users can create powerful visualizations.
Data Refresh and Scheduling – Keeps data up-to-date with automatic refresh.
AI Features – Includes features like Q&A, where users can ask questions in natural language.
Custom Visuals – Supports creation of custom visuals for specific needs.
Scalability – Suitable for small businesses as well as large enterprises.
Why Power BI?
Power BI has rapidly become one of the most popular tools for business intelligence and data analytics. Its ability to simplify complex data and present it through interactive visuals makes it an essential platform for organizations and professionals who want to make data-driven decisions.
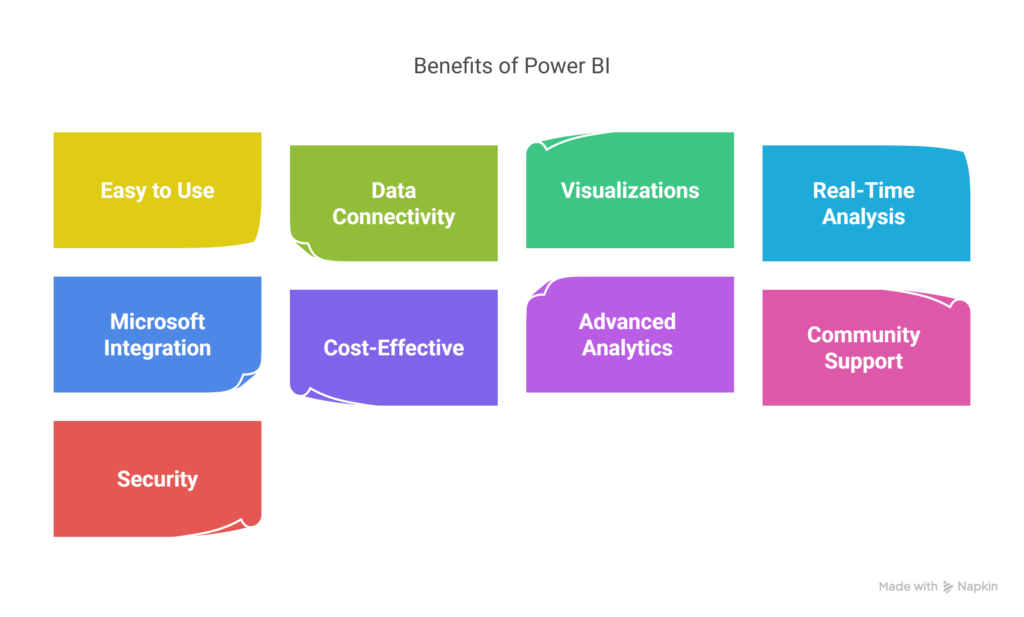
1. Easy to Use and Beginner-Friendly.
One of the key reasons for Power BI’s popularity is its user-friendly interface.
Even individuals with minimal technical knowledge can start creating meaningful reports using its drag-and-drop features.
Built-in templates, visuals, and guided analytics allow users to explore data without writing complex code.
2. Wide Range of Data Connectivity
Power BI can connect to hundreds of data sources, including:
Microsoft Excel
SQL Server
Azure
Google Analytics
SharePoint
Web APIs
Cloud services like Salesforce, Dropbox, and more
This flexibility in data integration allows users to bring together data from multiple systems into one unified view.
3. Interactive and Rich Visualizations
Power BI offers a wide collection of built-in visuals such as bar charts, pie charts, line graphs, maps, gauges, tables, and more. Users can also access a marketplace for custom visuals or create their own using tools like R or Python.
These visuals are not static – they are interactive, allowing users to click, filter, and explore data on the fly.
4. Real-Time Data Analysis
With Power BI, users can analyze data in real-time. Dashboards and reports can be refreshed automatically, ensuring that users always see the latest data. This feature is crucial for monitoring live data such as sales performance, inventory levels, customer feedback, or web traffic.
5. Seamless Integration with Microsoft Ecosystem
Power BI integrates smoothly with other Microsoft products such as:
Excel – Import pivot tables, charts, and formulas directly.
Azure – Connect to cloud-based data services.
Microsoft Teams – Share dashboards and collaborate on reports.
Power Platform – Combine with Power Apps and Power Automate for custom solutions.
This tight integration makes it easy for businesses already using Microsoft tools to adopt Power BI without major changes to their workflow.
6. Cost-Effective Business Intelligence
Power BI offers a free desktop version, making it accessible to students, small businesses, and professionals. The Pro and Premium versions are also competitively priced, offering advanced features like collaboration, large-scale data models, and on-premises report deployment.
Compared to traditional BI tools, Power BI provides high value at a low cost.
7. Advanced Analytics Capabilities
Power BI supports data modeling using DAX (Data Analysis Expressions), enabling advanced calculations and measures. It also includes AI-powered features, such as:
Natural language Q&A
Predictive analytics
Machine learning integration with Azure ML
These capabilities empower users to go beyond basic reporting and derive deep insights from their data.
8. Strong Community and Support
With a large and active community of users, developers, and experts, Power BI users benefit from:
Online tutorials and learning paths
Forums and user groups
Regular updates from Microsoft
Community-created visuals and tools
This supportive ecosystem ensures that help is always available when learning or solving problems.
9. Secure and Scalable
Power BI uses enterprise-grade security, including:
Row-level security (RLS)
Data encryption
Role-based access control
It’s also highly scalable, making it suitable for both small businesses and large enterprises managing big data environments.
How Power BI Works
Power BI is a powerful end-to-end business intelligence tool that enables users to connect, analyze, visualize, and share data easily.
The entire process is streamlined to help users transform raw data into meaningful insights.
Understanding how Power BI works involves knowing its data flow, core components, and the steps involved in creating reports and dashboards.
Power BI Workflow Overview
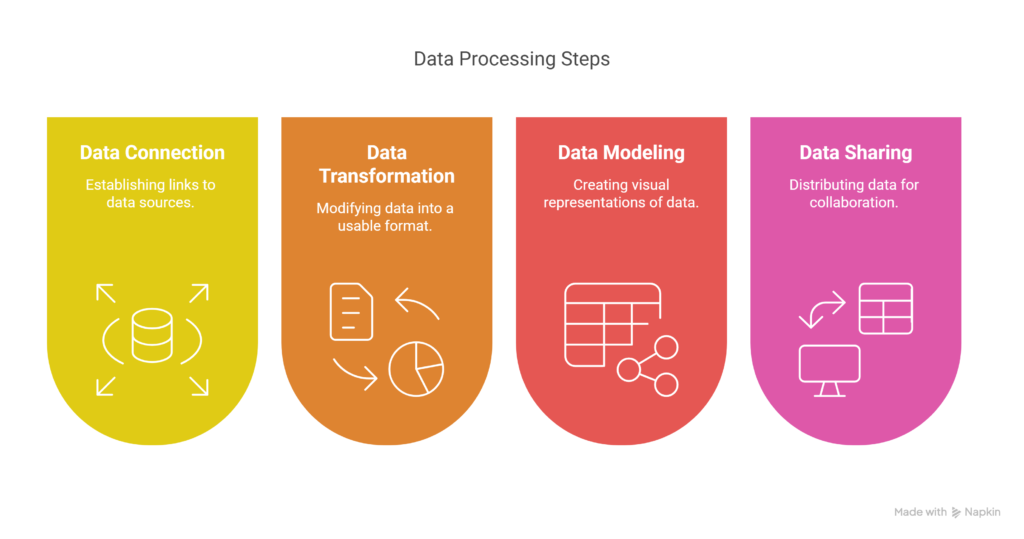
The Power BI workflow can be understood in four major stages:
Data Connection
Data Transformation
Data Modeling & Visualization
Data Sharing & Collaboration
1. Data Connection
Power BI allows you to connect to a wide variety of data sources – both structured and unstructured, from cloud-based services to on-premises databases.
Some common data sources include:
Microsoft Excel files
SQL Server databases
SharePoint lists
Web APIs
Google Analytics
Cloud services (Azure, Salesforce, etc.)
Power BI uses a tool called Power Query to connect and pull data into its environment.
2. Data Transformation (Power Query Editor)
Once data is imported, it often needs to be cleaned or reshaped. Power BI provides an intuitive interface called the Power Query Editor, where users can:
Remove unnecessary columns or rows
Filter and sort data
Rename fields
Merge and append tables
Change data types
Create calculated columns
This process is known as ETL (Extract, Transform, Load) – an essential step for preparing data before analysis.
3. Data Modeling & Visualization
After transformation, data is ready to be modeled and visualized.
a. Data Modeling
This includes:
Creating relationships between multiple tables
Designing a data schema (star or snowflake models)
Defining measures and calculated columns using DAX (Data Analysis Expressions)
Proper modeling ensures data is accurate, optimized, and ready for analysis.
b. Visualization
Power BI offers a range of visual elements:
Charts (bar, line, pie, area)
Tables and matrices
Maps (for location-based data)
Cards and KPIs
Slicers and filters
Users can build interactive reports and dashboards by dragging and dropping these visuals onto the report canvas. These visuals update dynamically when filters or slicers are applied.
4. Data Sharing & Collaboration
Once reports are created in Power BI Desktop, they can be published to the Power BI Service (Cloud).
In the cloud environment, users can:
Share dashboards with others
Set up automatic data refresh schedules
Collaborate within teams using Microsoft Teams or SharePoint
Embed reports in websites or apps
Manage data access and security
For organizations requiring on-premises solutions, Power BI Report Server can be used to host reports internally.
Optional: Real-Time Analytics and Advanced Features
Power BI also supports:
Streaming data for real-time dashboards
Natural language Q&A (users can ask questions like “Show sales by region”)
AI-powered visuals and machine learning integrations
Custom visuals using R, Python, or JavaScript
Summary: Power BI Process Flow
Here’s a simplified flow of how Power BI works:
Data Sources → Power Query (Transform) → Data Model (DAX + Relationships) → Reports & Dashboards (Visualize) → Publish to Power BI Service (Share)
How to Install Power BI.
Installing Power BI is a simple and straightforward process.
Microsoft offers Power BI Desktop as a free application for Windows, which allows users to create reports, dashboards, and perform data analysis locally on their system.
Below are the step-by-step instructions to install Power BI Desktop.
🔹 System Requirements
Before installing, make sure your system meets the basic requirements:
Operating System: Windows 10, Windows 11, or Windows Server 2019/2022
RAM: Minimum 4 GB (8 GB or more recommended)
.NET Framework: Version 4.7.2 or later
Disk Space: At least 2 GB free
Processor: 1 GHz or faster x64 processor
⚠️ Power BI Desktop is not available for macOS. Mac users can use Power BI via a virtual machine or cloud service.
🔹 Methods to Install Power BI Desktop
There are two main ways to install Power BI Desktop:
1. Installing via Microsoft Store (Recommended)
This method ensures automatic updates and easy management.
✅ Steps:
Open the Microsoft Store on your Windows device.
In the search bar, type “Power BI Desktop”.
Click on the official app named Power BI Desktop published by Microsoft.
Click Install (or Get, if it’s your first time).
Wait for the download and installation to complete.
Once installed, click Launch to open Power BI.
🟢 Benefits:
No need to manually update – it updates automatically.
Seamless and secure installation.
Recommended for beginners.
2. Installing via Direct Download (Power BI Website)
This method is useful if you don’t have access to the Microsoft Store (e.g., in restricted environments or enterprise systems).
✅ Steps:
Visit the official Power BI website:
https://powerbi.microsoft.comClick on the “Products” menu and choose “Power BI Desktop”.
Click Download free to go to the Microsoft download center.
Choose the correct version:
PBIDesktopSetup.exe (for 64-bit systems)
PBIDesktopSetup.msi (for enterprise installations)
After downloading, double-click the installer file.
Follow the on-screen instructions:
Choose installation language
Accept license terms
Select the install location
Click Install and wait for the setup to complete.
Once done, open Power BI from the Start Menu or Desktop.
🔹 First-Time Setup
After launching Power BI for the first time:
You may be prompted to sign in with a Microsoft account (optional for using Power BI Desktop).
You can skip sign-in if you’re just exploring.
You’ll see the main interface with options to get data, transform data, and build reports.

🔹 Power BI Service vs Power BI Desktop
| Feature | Power BI Desktop | Power BI Service (Web) |
|---|---|---|
| Use | Create reports | Share & collaborate online |
| Installation | Required | No installation needed |
| Data Modeling & DAX | Supported | Limited |
| Data Refresh Scheduling | Not available | Available |
| Sign-in | Optional | Required |