
Class 12th IP (065)
Practical 7
SOLUTION :-
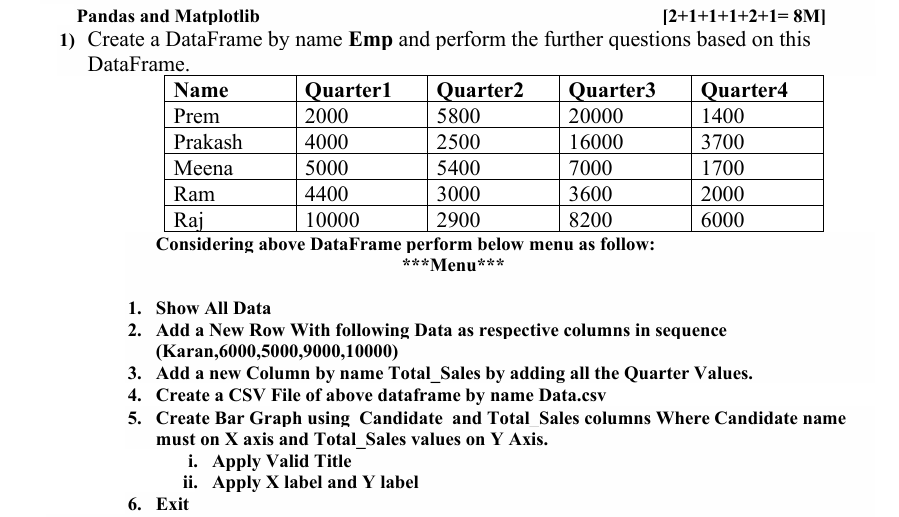
import pandas as pd
import matplotlib.pyplot as plt

Emp = pd.DataFrame({
    'Name': ['Prem', 'Prakash', 'Meena', 'Ram', 'Raj'],
    'Quarter1': [2000, 4000, 5000, 4400, 10000],
    'Quarter2': [5800, 2500, 5400, 3000, 2900],
    'Quarter3': [20000, 16000, 7000, 3600, 8200],
    'Quarter4': [1400, 3700, 1700, 2000, 6000]
})

print(Emp)

    while True:
    print("\n*** MENU ***")
    print("1. Show All Data")
    print("2. Add New Row")
    print("3. Add Total_Sales Column")
    print("4. Create CSV File")
    print("5. Create Bar Graph")
    print("6. Exit")

    ch = int(input("Enter your choice: "))

    if ch == 1:
        print(Emp)

    elif ch == 2:
        Emp.loc[len(Emp)] = ['Karan', 6000, 5000, 9000, 10000]
        print("New row added")

    elif ch == 3:
        Emp['Total_Sales'] = Emp['Quarter1'] + Emp['Quarter2'] + Emp['Quarter3'] + Emp['Quarter4']
        print(Emp)

    elif ch == 4:
        Emp.to_csv("Data.csv", index=False)
        print("CSV file created successfully")

    elif ch == 5:
        plt.bar(Emp['Name'], Emp['Total_Sales'])
        plt.title("Employee Total Sales Report")
        plt.xlabel("Candidate Name")
        plt.ylabel("Total Sales")
        plt.show()

    elif ch == 6:
        break

    else:
        print("Invalid Choice")
SOLUTION
Create Database
CREATE DATABASE B2_2026;
USE B2_2026;
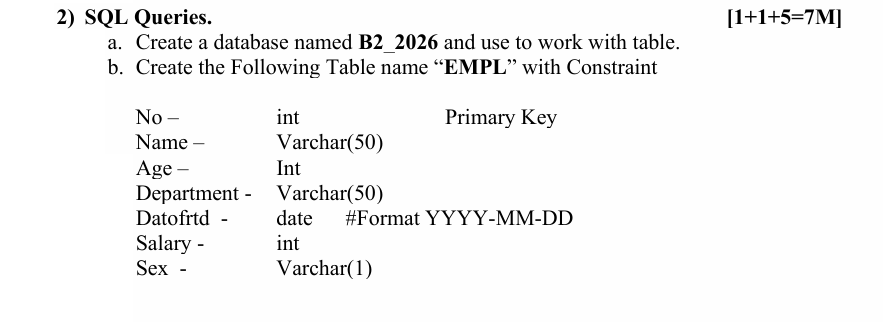
Table name “EMPL”
CREATE TABLE EMPL (
    No INT PRIMARY KEY,
    Name VARCHAR(50),
    Age INT,
    Department VARCHAR(50),
    Datofrtd DATE,
    Salary INT,
    Sex VARCHAR(1)
);
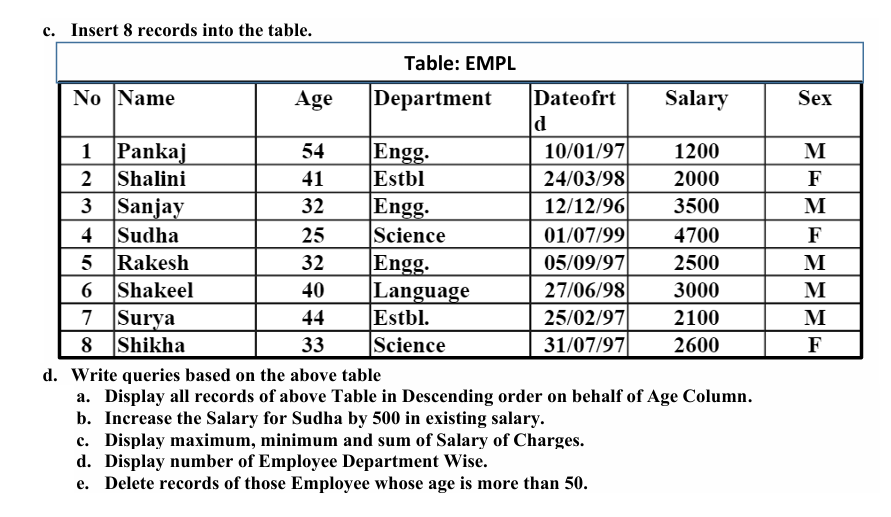
Insert 8 Records
INSERT INTO EMPL VALUES
(1,'Pankaj',54,'Engg.','1997-01-10',1200,'M'),
(2,'Shalini',41,'Estbl','1998-03-24',2000,'F'),
(3,'Sanjay',32,'Engg.','1996-12-12',3500,'M'),
(4,'Sudha',25,'Science','1999-07-01',4700,'F'),
(5,'Rakesh',32,'Engg.','1997-05-05',2500,'M'),
(6,'Shakeel',40,'Language','1998-06-27',3000,'M'),
(7,'Surya',44,'Estbl','1997-02-25',2100,'M'),
(8,'Shikha',33,'Science','1997-07-31',2600,'F');
4. SQL Queries
a) Display all records of above Table in Descending order on behalf of Age Column.
SELECT * FROM EMPL
ORDER BY Age DESC;
b) Increase the Salary for Sudha by 500 in existing salary.
UPDATE EMPL
SET Salary = Salary + 500
WHERE Name = 'Sudha';
c) Display maximum, minimum and sum of Salary of Charges.
SELECT
MAX(Salary) AS Maximum,
MIN(Salary) AS Minimum,
SUM(Salary) AS Total
FROM EMPL;
d) Display number of Employee Department Wise.
SELECT Department, COUNT(*) AS Total_Employees
FROM EMPL
GROUP BY Department;
e) Delete records of those Employee whose age is more than 50.
DELETE FROM EMPL
WHERE Age > 50;