3.1 Overview of R and its applications in data analysis and statistics. 3.2 Installing R and RStudio. 3.3 Basic R syntax, variables, and data types. 3.4 Importing data into R from different file formats (CSV, Excel, etc.). 3.5 Viewing and inspecting data frames.
NOTES
3.1 Overview of R and Its Applications in Data Analysis and Statistics.
🔹 Brief Explanation:
R is an open-source programming language mainly used for statistical analysis, data visualization, and data science. It offers a wide range of built-in functions and packages for performing complex data manipulation and analysis tasks. R is highly favored in academic, research, and professional fields due to its flexibility and accuracy in handling statistical data.
🔹 Detailed Explanation:
✅ What is R?
R is a powerful, open-source programming language and environment specifically designed for statistical computing and data visualization. It was developed by statisticians Ross Ihaka and Robert Gentleman in the early 1990s. R is widely used by data analysts, statisticians, researchers, and data scientists for performing data analysis, creating models, and generating visual insights.
✅ Key Features of R:
Free and Open Source: Available for all major platforms like Windows, macOS, and Linux.
Extensive Libraries: Thousands of packages are available for specialized tasks (e.g., ggplot2 for data visualization, dplyr for data manipulation).
Rich Visualization: Ability to create high-quality graphs, plots, charts, and dashboards.
Statistical Analysis: Offers tools for descriptive statistics, hypothesis testing, regression, and more.
Community Support: Large global community for support, tutorials, and documentation.
✅ Applications of R in Data Analysis and Statistics:
Application Area
Description
Descriptive Statistics
Summarizing data using mean, median, mode, standard deviation, etc.
Data Cleaning & Manipulation
Handling missing values, filtering, grouping, and reshaping data using packages like dplyr.
Exploratory Data Analysis (EDA)
Visualizing trends, distributions, and relationships through plots and graphs.
Statistical Modeling
Performing linear regression, logistic regression, time series analysis, etc.
Data Visualization
Creating pie charts, histograms, boxplots, scatterplots, etc., with packages like ggplot2.
Machine Learning
Implementing classification, clustering, decision trees, etc. with caret, mlr packages.
Report Generation
Automating reports using R Markdown and exporting in formats like PDF, HTML.
Bioinformatics / Healthcare
Used in genetic data analysis, epidemiology, and clinical trials.
Finance & Economics
Analyzing stock prices, risk mo
✅ Why Use R for Data Analysis?
Designed for data analysis from the ground up.
Offers reproducible research using R scripts and markdown.
Powerful in handling large and complex datasets.
Easily integrates with databases, Excel, and web data.
Supports statistical accuracy and advanced analytics.
✅ Example: Simple R Code for Summary Statistics.
# Load sample data
data <- c(12, 15, 14, 17, 18, 19, 20, 16)
# Calculate mean
mean(data)
# Calculate median
median(data)
# Standard deviation
sd(data)
✅ Conclusion:
R is a versatile language tailored for statistical and data-related tasks. Its strong ecosystem, flexibility, and support for analytics make it a vital tool for students, researchers, and professionals working with data. Whether you’re analyzing surveys or building predictive models, R offers the tools to explore and understand data deeply.
3.2 Installing R and RStudio
🔹 Brief Explanation:
To use R for data analysis, you need to install two main components: R, the programming language itself, and RStudio, a user-friendly interface (IDE) to write and manage R code efficiently. R must be installed first, followed by RStudio. Both are free and available for Windows, macOS, and Linux systems.
🔹 Detailed Explanation:
✅ Step-by-Step: Installing R and RStudio
1. Installing R
🔸 What is R?
R is the core programming language that executes statistical calculations and data processing tasks. It needs to be installed before RStudio because RStudio works on top of R.
Choose your operating system: Select from Windows, macOS, or Linux.
Download R: Click the relevant link and download the latest version of R.
Run the Installer: Open the downloaded file and follow the installation instructions. You can keep the default settings during the installation.
🔸 Check R Installation:
After installation, open the R Console from your desktop or start menu. You can try typing:
2. Installing RStudio
🔸 What is RStudio?
RStudio is an Integrated Development Environment (IDE) for R. It provides a user-friendly interface, making coding in R easier with features like syntax highlighting, script editing, plotting, and viewing variables and datasets.
Download RStudio Desktop (Free version): Choose the free edition for your operating system.
Run the Installer: Download the file and install it like any standard software.
🔸 Open RStudio:
After installation, launch RStudio. It automatically connects with your R installation and opens a workspace divided into:
Script Editor (Top-left)
Console (Bottom-left)
Environment/History (Top-right)
Plots/Files/Packages/Help (Bottom-right)
✅ Why Use RStudio with R?
Feature
R Only (Console)
RStudio (IDE)
Code editing
Basic
Advanced editor
Plot visualization
Simple
Dynamic preview
Package management
Manual
One-click install
Environment management
Command-based
Visual display
Report generation
Limited
Integrated Markdown
3.3 Basic R Syntax, Variables, and Data Types
🔹 Brief Explanation:
R uses simple syntax to write code for data analysis. It supports assigning values to variables, and working with various data types such as numeric, character, logical, and more. Understanding these basics is essential to write and understand R programs.
🔹 Detailed Explanation:
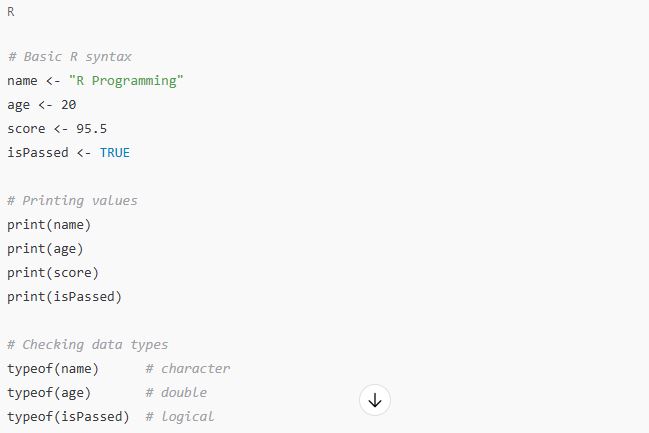
✅ 1. Basic R Syntax
R follows a simple and readable syntax. Here are a few essential points:
Concept
Description
Example
Commenting
Use # for writing comments
# This is a comment
Assignment
Use <-, =, or -> to assign values
x <- 10 or x = 10
Printing
Use print() or just type the variable name
print(x) or x
Functions
Use function name followed by parentheses
sqrt(25)
Case Sensitive
R is case-sensitive
x and X are different
✅ 2. Variables in R
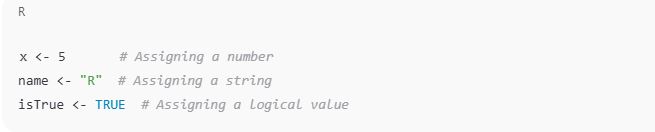
A variable is used to store data values. Variable names must begin with a letter and can contain letters, numbers, dots (.), and underscores (_).
🔸 Variable Declaration Examples:
🔸 Rules for Naming Variables:
Must start with a letter (a-z, A-Z)
Can contain digits, dot (.), or underscore (_)
Cannot start with a number or use reserved keywords (if, else, for, etc.)
✅ 3. Data Types in R
R supports multiple built-in data types. Understanding them helps to store and work with different kinds of data.
🔸 Common Data Types in R:
Data Type
Description
Example
Numeric
Real numbers (integers and decimals)
10, 3.14
Integer
Whole numbers only
as.integer(5)
Character
Text or string values
"Hello", 'R'
Logical
TRUE or FALSE values
TRUE, FALSE
Complex
Complex numbers with imaginary parts
2+3i, sqrt(-1)
Raw
Raw bytes data (rarely used)
charToRaw("AB")
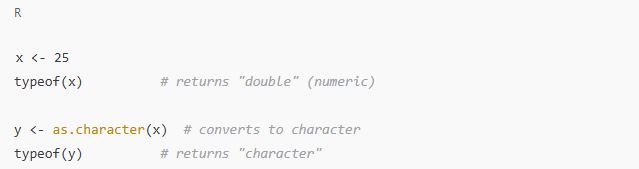
🔸 Checking and Converting Data Types:
✅ Example Program Demonstrating All Concepts:
3.4 Importing Data into R from Different File Formats (CSV, Excel, etc.)
🔹 Brief Explanation:
R allows importing data from various file formats like CSV, Excel, and text files using specific functions and packages. This helps users to load real-world datasets into R for analysis. The most commonly used functions include read.csv() for CSV files and read_excel() from the readxl package for Excel files.
🔹 Detailed Explanation:
✅ Why Import Data in R?
In most real-life scenarios, data is stored in external files such as Excel sheets or CSV files. Before you can analyze the data in R, you need to import it into your R environment. R provides built-in functions and external packages to read and manage different file formats efficiently.
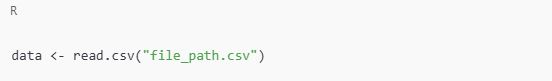
✅ 1. Importing CSV Files
🔸 CSV (Comma Separated Values) is a plain-text format where each line represents a row, and values are separated by commas.
🔸 Function Used:read.csv()
✅ Syntax:
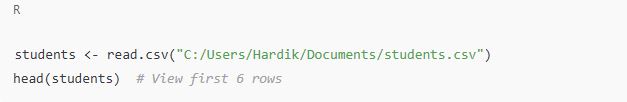
✅ Example:
✅ Useful Parameters:
header = TRUE: First row is treated as column names (default).
sep = ",": Separator (used for .txt files with tabs or other separators).
stringsAsFactors = FALSE: Avoid automatic conversion to factors.
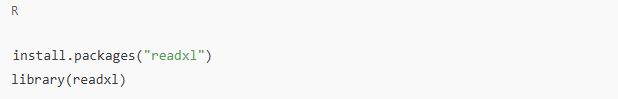
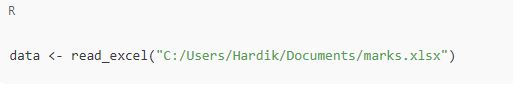
✅ 2. Importing Excel Files
🔸 Excel Files (both .xls and .xlsx) are widely used for storing structured data.
🔸 Packages Required:readxl or openxlsx
➤ Using readxl package:
✅ Step 1: Install and load the package
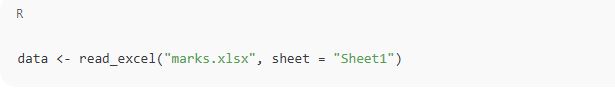
✅ Step 2: Read Excel file.
✅ Optional: Specify sheet name or number
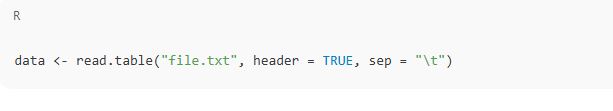
✅ 3. Importing Text Files
Text files may use tab (\t), comma, or space as separators.
🔸 Function Used: read.table()
✅ Syntax:
✅ 4. Importing Data from Other Sources
🔹 Importing Data into R – Sources, Functions, and Examples
Source
Function/Package
Example
CSV
read.csv()
read.csv("data.csv")
Excel (.xlsx/.xls)
read_excel() from readxl
read_excel("file.xlsx", sheet = 2)
Text (.txt)
read.table()
read.table("file.txt", sep = "\t", header = TRUE)
Google Sheets
gs4_get() from googlesheets4
Requires authorization and package installation
JSON
fromJSON() from jsonlite
fromJSON("file.json")
SQL Database
DBI + RMySQL/RSQLite
Connect and query databases
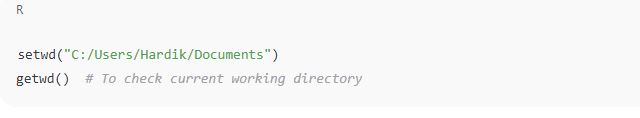
✅ Set Your Working Directory (Optional but Useful):
3.5 Viewing and Inspecting Data Frames
🔹 Brief Explanation:
In R, a data frame is a table-like structure used to store data in rows and columns. To understand and analyze data, we need to view and inspect its structure, summary, and content. R provides several functions like head(), tail(), str(), and summary() to explore data frames effectively.
🔹 Detailed Explanation:
✅ What is a Data Frame in R?
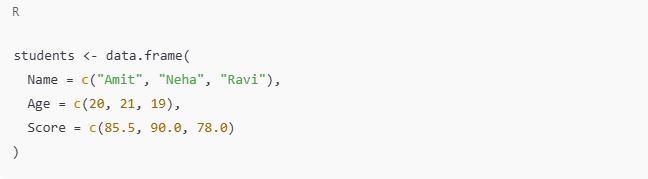
A data frame is one of the most commonly used data structures in R. It is a 2-dimensional tabular structure where:
Each column can have a different data type (numeric, character, logical, etc.).
Each row represents an observation.
🔸 Example: Creating a Data Frame
✅ Functions to View and Inspect Data Frames
Here are some key functions to view and examine a data frame:
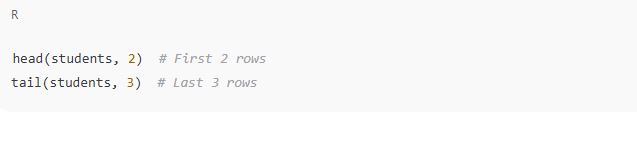
🔹 1. View Top or Bottom Rows
🔹 Basic R Data Viewing Functions
Function
Description
Example
head()
Shows first 6 rows (default)
head(students)
tail()
Shows last 6 rows (default)
tail(students)
You can also specify the number of rows:
🔹 2. Structure and Summary
🔹 R Functions for Viewing and Inspecting Data Frames
Function
Description
Example
str()
Shows structure, data types, and preview of values
str(students)
summary()
Provides statistical summary of each column
summary(students)
dim()
Returns dimensions (rows, columns)
dim(students)
nrow()
Returns number of rows
nrow(students)
ncol()
Returns number of columns
ncol(students)
names()
Shows column names
names(students)
colnames()
Another way to see or set column names
colnames(students)
🔹 3. Accessing Specific Data
🔹 Accessing Data in R Data Frames
Task
Example
Access one column
students$Name
Access by index
students[1, ]
Access specific cell
students[1, 2]
Access multiple rows/cols
students[1:2, c("Name", "Score")]
🔹 4. View Entire Data Frame
Print entire data: Simply type the name of the data frame:
Use View() for GUI table view (RStudio only):
✅ Conclusion:
R is a versatile language tailored for statistical and data-related tasks. Its strong ecosystem, flexibility, and support for analytics make it a vital tool for students, researchers, and professionals working with data. Whether you’re analyzing surveys or building predictive models, R offers the tools to explore and understand data deeply.
Installing R and RStudio is the first step toward using R for data analysis and statistics. While R provides the language and tools for computation, RStudio adds a friendly and powerful interface to work efficiently. Both are free, open-source, and essential for anyone working with data in R.
Understanding R’s basic syntax, variables, and data types forms the foundation for writing efficient R programs. With this knowledge, you can store, manipulate, and analyze different kinds of data, which is essential for data science and statistics using R.
Importing data is the first step in any data analysis process. R provides multiple tools and packages to import data from common formats like CSV, Excel, and text files. Once imported, the data can be explored, cleaned, and analyzed. Mastering data import ensures smooth handling of real-world datasets.
Inspecting and understanding a data frame is a crucial step before performing data analysis. R offers a variety of built-in functions to view, summarize, and explore the contents and structure of data frames efficiently. Mastery of these tools helps in identifying data patterns, missing values, and understanding variable types.