Unit-4: Data Filtering and cleaning

Unit-4: Data Filtering and cleaning

4.1 Subsetting and filtering data.
4.2 Adding, removing, and renaming variables/columns.
4.3 Data Cleaning and Transformation
4.4 Identifying and handling missing values.
4.5 Data type conversion and recoding variables.

NOTES

Unit 4.1: Subsetting and Filtering Data

🔹 Brief Explanation:

Subsetting and filtering data means selecting specific parts of a dataset based on certain conditions. It helps focus on relevant information by removing unwanted rows or columns. This process is important for data analysis and cleaning.

🔹 Detailed Explanation:

When working with large datasets, it is often necessary to extract only the data that is important or relevant for analysis. This is where subsetting and filtering come into play.

1. Subsetting Data

Subsetting refers to selecting specific rows, columns, or both from a dataset.

A. Subsetting Rows:

This means selecting specific records based on index numbers or a condition.

Example in R:

B. Subsetting Columns:

This involves selecting only the needed columns from a dataset.

Example in R:

C. Subsetting Rows and Columns Together:

2. Filtering Data

Filtering means selecting rows based on specific logical conditions.

Examples in R:

  • Filter rows where Age > 18

  • Filter rows where Gender is “Male”

  • Using dplyr package:

Why Subsetting and Filtering Are Important?

  • Helps focus only on meaningful data

  • Reduces memory and processing time

  • Makes data analysis more efficient

  • Helps remove errors and outliers

Use Cases:

Task Purpose
Selecting specific columns To focus on important variables
Filtering rows To analyze specific categories or conditions
Removing missing or invalid data To clean the dataset

Real-Life Example:

Suppose you have a dataset of student records with names, marks, and grades.
You want to:

  • View only students who scored above 75%

  • Focus only on “Name” and “Marks” columns

You will:

  1. Filter rows where Marks > 75

  2. Subset columns “Name” and “Marks”

Unit 4.2: Adding, Removing, and Renaming Variables/Columns

🔹 Brief Explanation:

Adding, removing, and renaming columns (also called variables) in a dataset is an important part of data cleaning. It helps you modify the structure of your data according to your needs, such as including new information, getting rid of unwanted data, or making column names more readable and meaningful.

🔹 Detailed Explanation:

When working with data frames in R (or other data tools), it’s common to manage variables (columns) to prepare the dataset for analysis. Here’s how:

1. Adding Variables/Columns

You can add a new column to a data frame by assigning a new value or calculation to it.

Example in R:

  • This creates a new column TotalMarks by adding marks of three subjects.

You can also add columns using the mutate() function from the dplyr package:

2. Removing Variables/Columns

To remove a column, you can set it to NULL or use a function that excludes it.

Example in R (using NULL):

Using dplyr’s select() to remove a column:

  • The minus sign - tells R to exclude that column.

3. Renaming Variables/Columns

Renaming helps make column names more understandable and meaningful.

Example in R (base method):

Using dplyr’s rename() function:

  • Here, NewName is the new column name, and OldName is the existing column name.

✅ Why is this important?
Operation Purpose
Add Columns To calculate new values, such as totals, averages, or categories
Remove Columns To eliminate irrelevant or redundant data
Rename Columns To improve clarity, consistency, and understanding of the dataset

Real-Life Example:

Suppose you’re working with a student performance dataset:

  • Add a column Percentage based on total marks.

  • Remove a column RollNo if it is no longer required.

  • Rename the column StdName to StudentName for better readability.

Unit 4.3: Data Cleaning and Transformation

🔹 Brief Explanation:

Data cleaning and transformation are essential steps in preparing data for analysis. Data cleaning involves fixing or removing incorrect, incomplete, or duplicated data. Data transformation means converting data into the right format or structure so that it can be analyzed efficiently.

🔹 Detailed Explanation:

1. What is Data Cleaning?

Data cleaning (also called data cleansing) is the process of detecting and correcting (or removing) errors and inconsistencies in a dataset. The goal is to improve the quality and reliability of the data before using it for analysis or modeling.

Common Data Cleaning Tasks
Task Description
Handling missing values Replacing or removing missing (NA or NULL) values
Removing duplicates Eliminating repeated rows
Correcting errors Fixing typos or incorrect entries
Standardizing formats Ensuring consistent format (e.g., date as YYYY-MM-DD)
Trimming whitespaces Removing extra spaces from text

Example in R:

2. What is Data Transformation?

Data transformation involves changing the structure, format, or values of data to make it suitable for analysis. This process helps organize data, enhance its quality, and derive meaningful insights.

Common Data Transformation Tasks:

Data Transformation Tasks
Task Description
Changing data types Converting strings to numbers, or dates to proper date format
Scaling data Normalizing or standardizing values for comparison
Creating new columns Deriving new values from existing columns (e.g., calculating BMI)
Aggregating data Summarizing data using totals, averages, counts, etc.
Encoding categorical variables Converting text values (like "Male", "Female") to numeric codes

Why Data Cleaning and Transformation are Important:

Benefits
Ensures data accuracy and completeness
Helps avoid misleading or wrong analysis results
Makes data compatible with statistical models and tools
Saves time and effort during the analysis process

Real-Life Example:

Suppose you receive a dataset from a school with the following problems:

  • Some marks fields are empty.

  • Names are written with extra spaces.

  • Date of Birth is in different formats.

  • Duplicate entries exist.

You must:

  • Fill missing marks with the average.

  • Trim spaces from names.

  • Convert all dates to a common format.

  • Remove duplicates.

Only after cleaning and transforming, you can confidently analyze the data.

Unit 4.4: Identifying and Handling Missing Values

🔹 Brief Explanation:

Missing values are gaps or empty fields in a dataset where data should be present. Identifying and handling these missing values is a crucial step in data cleaning. If not treated properly, missing values can lead to incorrect or misleading analysis results.

🔹 Detailed Explanation:

1. What are Missing Values?

Missing values occur when no data is recorded for a particular cell in a dataset. In R, missing values are represented as NA. These can arise due to various reasons such as:

  • Data entry errors

  • Survey questions left unanswered

  • Technical issues during data collection

  • Unavailable information

2. Identifying Missing Values

Before handling missing data, we must first detect where the missing values are.

In R:

  • Check for missing values in a dataset:

  • Identify rows with missing values:

3. Handling Missing Values

There are multiple ways to deal with missing data, depending on the type of analysis and the amount of missing data.

A. Removing Missing Data

  • Remove rows with missing values:

  • Remove only if too many values are missing or they affect results significantly.

B. Replacing (Imputing) Missing Data

Instead of removing, we can fill in the missing values with appropriate substitutes:

Methods to Handle Missing Data
Method Description
Mean/Median/Mode Replace with average or most common value
Constant value Replace with 0, "Unknown", or other custom value
Prediction model Use regression or machine learning to estimate the missing value

C. Using Forward or Backward Fill (Time Series)

In time-series data:

✅ Impact of Missing Values
Risk Impact
Skewed analysis Can distort average or trend calculations
Reduced accuracy Affects prediction or classification models
Data loss Too much deletion can remove useful information

Best Practices:

  • Always explore the reason for missing data before deciding how to handle it.

  • Use visual tools (like heatmaps) to locate missing values easily.

  • Choose a handling method that fits the nature of data and analysis goals.

Real-Life Example:

You have a student dataset where some students’ “Math Marks” are missing. If the number is small, you may delete those rows. But if many are missing, you might fill them with the class average for Math. This ensures that your analysis remains balanced and useful.

Unit 4.5: Data Type Conversion and Recoding Variables

🔹 Brief Explanation:

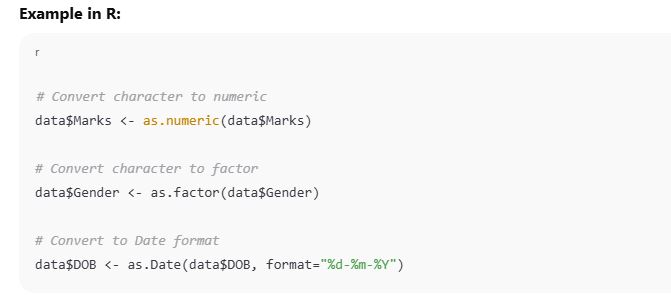
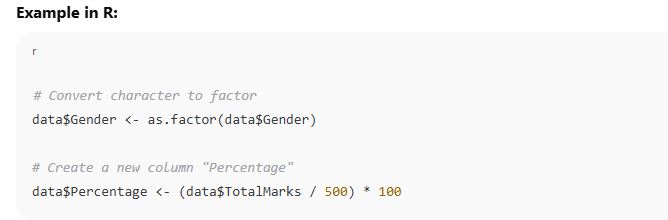
Data type conversion is the process of changing a variable from one data type to another (e.g., from character to numeric).
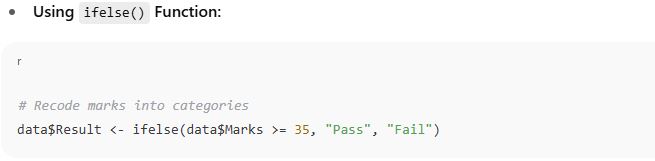
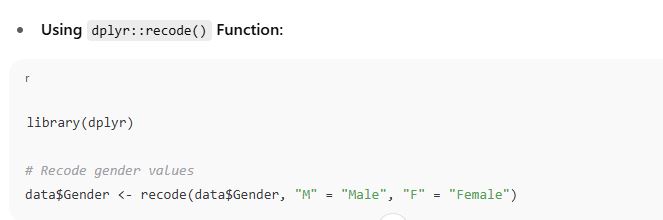
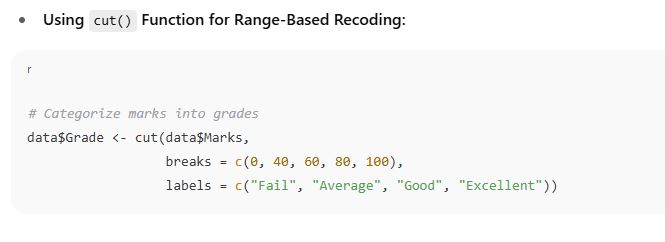
Recoding variables means modifying the values of variables — for example, changing categories or grouping values for better analysis. Both tasks are essential in preparing data for analysis and visualization.

🔹 Detailed Explanation:

✅ 1. What is Data Type Conversion?

In any dataset, each column or variable has a specific data type such as:

  • Numeric (e.g., 25, 99.5)

  • Character (e.g., “Yes”, “No”)

  • Factor (for categorical data)

  • Date/Time

Sometimes, we need to change a column’s type for proper analysis or visualization. This is known as data type conversion or type casting.

🔸 Why Convert Data Types?

  • To perform calculations (e.g., converting strings to numbers)

  • To format data correctly (e.g., treating text as factors for categories)

  • To avoid errors during analysis or visualization

2. What is Recoding Variables?

Recoding is the process of changing values within a variable for simplification or categorization.

🔸 Why Recode Variables?

  • To group values into categories (e.g., “1”, “2”, “3” → “Low”, “Medium”, “High”)

  • To correct or standardize values (e.g., spelling mistakes)

  • To convert text into numerical codes for modeling

Methods to Recode Variables:

✅ Examples of Use Cases
Task Example
Convert “25” (string) to 25 (number) For numerical analysis
Convert “Male”, “Female” to factor For classification models
Recode age 0–17 as “Child”, 18–60 as “Adult” For demographic studies
Replace "Y", "N" with "Yes", "No" For consistency and clarity

Best Practices:

  • Always check the current data types using str() or class() functions.

  • Avoid unintended conversions that may lead to loss of information.

  • Use meaningful labels when recoding categories.

✅ Conclusion:

  • Subsetting and filtering are essential skills for data cleaning and preparation. They help in narrowing down large datasets to only the relevant and useful data, making analysis easier and more effective.

  • Adding, removing, and renaming columns are core tasks in data cleaning and transformation. They help you organize data effectively, make it more readable, and ensure it’s suitable for analysis or visualization.
  • Data cleaning ensures the dataset is correct, consistent, and usable, while data transformation reshapes it to fit the needs of analysis or visualization. These steps are crucial for making data reliable, readable, and ready for further use in decision-making or modeling.
  • Identifying and managing missing values is a vital part of data preprocessing. Whether you remove or replace them, your choice should ensure that the dataset remains accurate and meaningful for analysis. Proper handling improves data quality and the reliability of results.

  • Data type conversion ensures that variables are in the correct format for processing, while recoding helps simplify and organize values for better interpretation. Both steps play a crucial role in cleaning and preparing data for analysis, machine learning, or reporting.

Leave a Reply

Your email address will not be published. Required fields are marked *

sign up!

We’ll send you the hottest deals straight to your inbox so you’re always in on the best-kept software secrets.