Chapter 1 Economics: An Introduction

Chapter 1 Economics: An Introduction
1. Choose the correct option for the following from the options provided :
1. What is the science which studies human behaviour and deals with economic problems called?
(A) Philosophy
(B) Physics
(C) Economics
(D) Statistics
2. From which Greek word is economics derived?
(A) Oikonomikos
(B) Ecology
(C) PHILO
(D) NOMOS
3. Who is known to be the first economist to have started studying economics as a separate science?
(A) Kautilya
(B) Marshall
(C) Robbins
(D) Adam Smith
4. Who introduced economics as a real science?
(A) Adam Smith
(B) Robbins
(C) Samuelson
(D) Marshall
5. In how many branches is economics classified by the method of study and analysis?
(A) Four
(B) three
(C) two
(D) five
6. On which axis are the independent variables like countries, year, rainfall, etc. usually represented?
(A) Vertical axis
(B) Horizontal axis
(C) On the point of origin
(D) On the corner of the graph
7. Who has written the book ‘Principles of Economics’?
(A) Adam Smith
(B) Marshall
(C) Robbins
(D) Samuelson
2. Answer the following questions in one sentence :
1. State the definition of economics given by Robbins.
Answer:
According to Robbins, economics is a discipline that examines how individuals behave in relation to their goals and the limited resources that have multiple possible uses.
2. Which is the focus point of Samuelson’s definition of economics?
Answer:
Samuelson’s definition highlights decision-making, resource distribution, and analyzing the costs and advantages linked to those choices.
3. Which are the three ways of representing economic information?
Answer:
Economic data or analysis can be displayed in the following three formats:
In descriptive or written form
Using tabular data
By graphical or diagrammatic methods
4. On which axis are the independent and dependent variables usually represented?
Answer:
Usually, the X-axis is used to show independent variables like time, and the Y-axis displays dependent variables affected by them.
5. What is a pie diagram?
Answer:
A pie chart is a circular graph divided into segments, where each segment illustrates a part of the total. The values are converted into angles, and each portion reflects its share of the entire data set.
3. Answer the following questions in short :
1. Give Kautilya’s definition of economics.
Answer:
Around 2500 years ago, Kautilya, also known as Chanakya, presented his thoughts on economic activities in his famous work Arthashastra. He explained that the primary objective of human life is to attain ‘arth’, which means wealth. The land a person inhabits is viewed as his wealth, and therefore, the discipline that explores the creation and utilization of wealth on earth is termed economics.
2. Explain Marshall’s definition of economics.
Answer:
Alfred Marshall:
In his book Principles of Economics published in 1890, Alfred Marshall defined economics as “a study of mankind in the ordinary business of life.” This means that economics examines the daily life of individuals as they strive to improve their material standard of living.
While this definition mainly focuses on material well-being and leaves out non-material aspects, it remains significant because it places human welfare at the heart of economic study.
3.Explain the difference between economic and non – economic activities.
Answer:
| Economic activity | Non-economic activity |
|---|---|
| 1. An activity performed with the purpose of obtaining economic benefits in the form of income is called economic activity. | 1. An activity which is done without the purpose of obtaining economic gains is called non economic activity. |
| 2. Objective of making economic gains, satisfaction of some want and involvement of exchange and cost are important aspects of an economic activity. | 2. Unlike economic activities, such activities do not involve exchange of benefits on both sides of the transaction. |
| 3. Activities done by farmers, lawyers, teachers, actors, government, etc. are all example of economic activities. | 3. Charitable activity, or activities done out of love, affection, compassion, such as social service, mother teaching her son, etc. are all non economic activities. |
4.Specify the difference between microeconomics and macroeconomics.
Answer:
| Microeconomics | Macroeconomics |
|---|---|
| 1. Microeconomics is the study and analysis of economics at an individual, group or company level. | 1. Macroeconomics is the study of national economy as a whole. |
| 2. Microeconomic analysis uses the ‘Principle of Marginalism’ to analyze how individual units make decisions in an economy. | 2. Macroeconomic analysis has helped to develop principles for managing resources in such a way that leads to increase in national income, reduce unemployment, poverty, inflation and so on. |
| 3. Determining price and wages, equilibrium output level for firm, etc. are studied here. | 3. Macroeconomics studies determining national income, unemployment, poverty, etc. |
5. “Statistical information is necessary to know the direction and condition of growth of an economy” explain.
Answer:
Economics and statistics are closely connected. It is nearly impossible to study economics effectively without using statistical tools.
Economics introduces various theories and hypotheses, but we cannot accept and apply them without testing.
To verify their accuracy, it is essential to analyze them in actual situations over different periods and locations.
This requires collecting data from real-life economic activities over time.
Such data is then organized and expressed in numerical terms using statistical methods.
The insights gained through statistical analysis help validate the theories and concepts developed in economics. Moreover, this data helps us understand the direction, patterns, and progress or decline of economic indicators.
Therefore, statistical data plays a crucial role in understanding the condition and direction of a country’s economic growth.
4. Answer the following questions in brief points :
1. Explain the definitions of economics by Adam Smith and Marshall.
Adam Smith:
According to Adam Smith, “Economics is an inquiry into the nature and causes of the wealth of nations.”
This implies that economics deals with the production and exchange of wealth generated by human labor.
He was the first to classify economics as a social science—since he studied human behavior (society) and adopted a scientific approach.
After Adam Smith’s contributions, economics began to be considered as a standalone scientific field, rather than a part of philosophy.
He highlighted the importance of human welfare and how economic behavior is linked to societal well-being.
Alfred Marshall:
Alfred Marshall, in his famous book Principles of Economics published in 1890, defined economics as “a study of mankind in the ordinary business of life.”
This definition emphasizes that economics looks into the routine efforts people make to ensure material comfort and satisfaction.
Marshall’s definition views economics as the study of daily human activities aimed at acquiring material well-being.
Although this explanation is limited to material aspects and not broader human values, its strength lies in focusing on human welfare as the central aim.
2. Give the points of importance of statistical information in the study of economics.**
Statistics is vital in economics. It helps analyze data and supports the theoretical framework of the subject. Here are the main reasons for its importance:
1. Statistical data helps validate economic theories:
Economic analysis has two dimensions:
The philosophical part, which studies human nature.
The scientific part, which uses tools to establish laws and principles.
Theories in economics need to be verified in actual situations across various times and locations.
Statistical tools assist in gathering such real-world data in measurable terms.
Examples:
A relationship between rainfall and agricultural output can be tested using statistical records of different regions and years.
Similarly, the link between price levels and demand of goods can be confirmed using data collected from the market.
2. Statistical tools help identify economic trends:
By analyzing data, we can identify the direction and intensity of changes in various economic indicators.
Examples:
Observing how the revenue of a firm changes over time.
Studying employment patterns within a country.
Identifying trends in sectoral output, such as agriculture or industry.
These trends help policymakers to shape appropriate policies. Individuals and businesses can also make informed decisions using this data.
3. Makes comparison easier:
When reliable statistical data is available, it becomes simple to compare economic variables across different time periods, regions, or nations.
Examples:
Comparing India’s national income growth from 1951 to 2015.
Analyzing India’s inflation, per capita income, etc., in comparison to countries like the USA, UK, or China.
4. Ensures clarity through data presentation:
Economic facts are often better understood when shown through graphs and charts rather than just described in text.
For example, inflation rates, income inequality, or agricultural productivity trends can be effectively explained with visual data.
Such representation makes it easier for common people to understand complex economic information.
3.Give an idea regarding Indian economic thought.**
India has a civilization and cultural heritage that dates back over 5000 years. Indian philosophy explores different dimensions of life and offers a spiritual and practical way of living.
A key part of this philosophy is the idea of ‘Purushartha’, which means the four goals of human life:
Dharma – moral duty
Artha – wealth or purposeful living
Kama – desire or enjoyment
Moksha – spiritual liberation
Among these, Artha relates to earning wealth and pursuing economic activities.
Any action done to gain a benefit or utility is considered an economic activity, and such activities form the basis of economics.
Nearly 2500 years ago, Kautilya (also known as Chanakya) authored the Arthashastra, where he outlined the significance of wealth for both individuals and the state.
He believed that land and property were the core of wealth, and managing them efficiently is central to economics.
Thus, his teachings formed one of the earliest structured economic thoughts in Indian history.
4. Clarify the importance of economics.
Importance of Economics:
As goods become scarcer and more valuable, most items needed in daily life fall under economic goods.
Because of this, nearly every human activity involves economic decision-making, raising the significance of economics in both practical life and as a scientific discipline.
Economics is important for understanding:
Human behavior
Societal functioning
Government policy
Business decisions
The following points elaborate on the relevance of economics:
1. Helps understand daily human actions:
Economics aids in understanding how individuals, communities, and nations manage their resources and solve problems in daily life.
(A) Understanding Global Events:
Events in countries like the USA, Russia, or China often impact people worldwide.
For example, a rise in international crude oil prices affects fuel costs in many nations.
People try to understand why some countries are rich while others are poor, and economic analysis provides these insights.
With global access to data, economics also helps improve technology and awareness.
(B) Understanding Historical Incidents:
Economic study sheds light on major historical changes.
It helps explain events like:
The arrival of the East India Company for trade.
The establishment of British Rule in India.
Resistance to British goods.
The growth of labor movements.
2. Economic significance in decision-making:
(A) Personal Decision-Making:
Individuals like doctors, artists, or families aim to maximize their benefits by using time and money wisely.
They make choices that offer the highest returns for the least effort or cost—this is a key principle of economics.
(B) Interpreting Government Policies:
Understanding economics helps interpret policies on taxes, wages, or employment.
People and businesses make better decisions based on policies such as REPO and Reverse REPO rates declared by the Reserve Bank of India, which influence savings and investment behavior.
(C) Professional and Business Decision-Making:
Economic theories offer businesses a scientific framework for choices regarding:
Pricing
Wage setting
Production planning
Employment decisions
It also explains what might happen under certain conditions—e.g., intense competition may lead to price cuts, affecting profit.
Economics equips individuals to act wisely in roles like consumer, producer, or laborer.
Even simple actions like buying groceries, choosing a smartphone, or planning a trip involve economic thinking to maximize benefits while minimizing costs.
5. Answer the following questions in detail :
1. Give an idea of the development of economics as a science in the west.
Answer:-
The Greek philosopher Aristotle discussed economic ideas in his work titled Oeconomica.
During the Industrial Revolution in Western countries, the concepts of division of labour and specialization became prominent in industries. This meant specific tasks were assigned to individual workers or teams who became skilled in performing only those tasks.
Such practical developments encouraged the broader classification of knowledge, leading to the emergence of specialized branches in different fields, including science. Social Science began to grow as a distinct area just like Physics and Mathematics.
Rather than relying only on descriptive arguments, Social Sciences started using scientific methods and tools. As a result, the study of human activities became more focused and evolved beyond just political or social philosophy into a systematic scientific field.
Adam Smith thoroughly analyzed the generation of wealth and authored a book in 1776 titled An Inquiry into the Nature and Causes of the Wealth of Nations, commonly referred to as Wealth of Nations.
This book laid the foundation for the subject of Economics as a separate and well-defined discipline in the Western world.
Following the adoption of economic ideas, industries began to implement modern machines and made large-scale investments to boost production. Consequently, the Industrial Revolution introduced a fresh economic lifestyle and innovative ways to generate wealth.
2. ‘Graphs/diagrams are a better method of precisely presenting economic information.’ Explain.
Answer:
When conducting economic analysis, a significant amount of numerical data is produced. This data can be illustrated clearly through various types of graphs and diagrams, offering better understanding.
Economics frequently uses diagrams to demonstrate linear and non-linear relationships. The demand curve is a commonly known example of such graphical representation.
Besides this, other often-used visual tools in economics include:
(A) Bar Diagram:
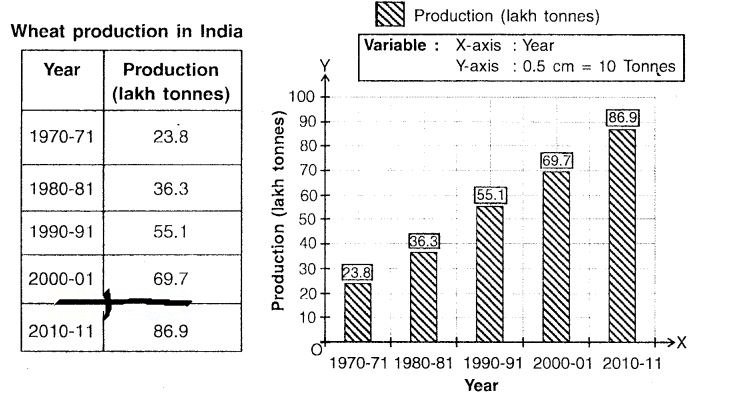
A bar diagram, also known as a bar chart or graph, displays grouped data using rectangular bars. The height or length of each bar corresponds proportionately to the value it represents.
Example:
Production figures of wheat in India can be effectively displayed using a bar chart.
(B) Grouped or Clustered Bar Diagram:
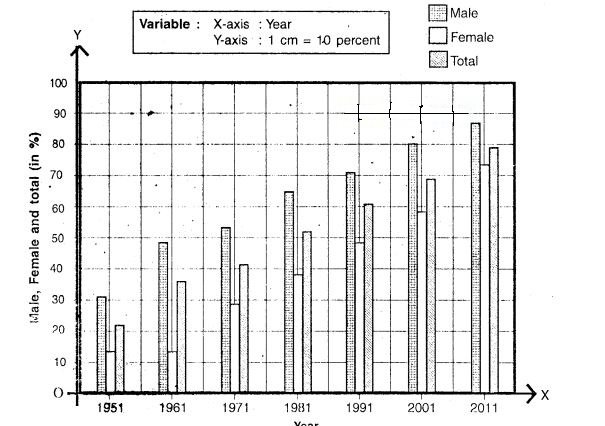
This chart is used when a dataset is categorized under multiple variables.
Example:
To study Gujarat’s literacy rates over different years—such as male, female, and overall literacy—a grouped bar chart can be created. Each group (year) consists of three bars, one for each category, distinguished by different colors or patterns.
| Years | Male | Female | Total |
|---|---|---|---|
| 1951 | 30.17 | 12.79 | 21.09 |
| 1961 | 48.73 | 12.77 | 36.19 |
| 1971 | 53.78 | 29.00 | 41.84 |
| 1981 | 65.10 | 38.50 | 52.20 |
| 1991 | 73.13 | 48.64 | 61.29 |
| 2001 | 80.50 | 58.60 | 69.14 |
| 2011 | 87.23 | 70.73 | 79.31 |
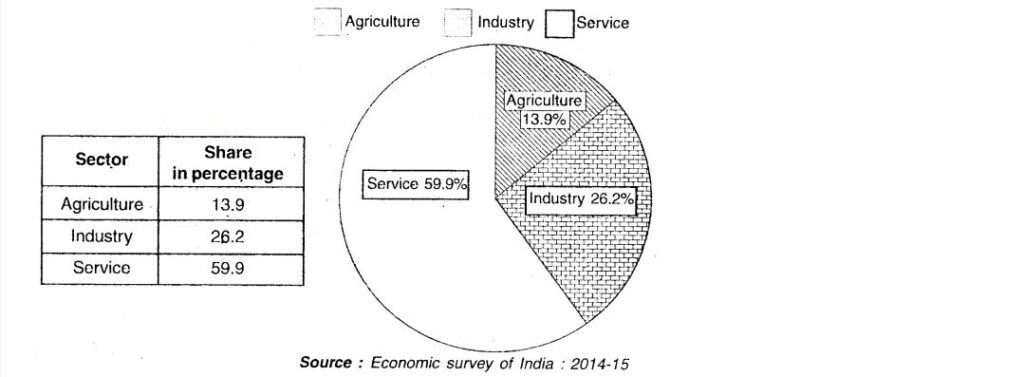
(C) Pie Diagram:
A pie chart divides a circle into sectors, where each sector shows a specific part of the whole. The data values are first converted into angles, and these angles form individual slices of the circle.
Example:
The contributions of agriculture, services, and industry to India’s national income can be shown using a pie chart, making each sector’s share visually easy to compare.
These graphical methods make economic facts clearer and easier to grasp for a wider audience, including those unfamiliar with complex data.