
Data Handling Using Pandas -I

Data Handling Using Pandas -I
NOTES
🔹 Introduction to Python Libraries: Pandas, NumPy, and Matplotlib
✅ Brief Explanation:
Python libraries like Pandas, NumPy, and Matplotlib are essential tools for data analysis, scientific computing, and data visualization.
NumPy provides fast mathematical operations and multi-dimensional arrays.
Pandas helps in handling structured data through powerful data structures like Series and DataFrame.
Matplotlib is used to create charts and graphs for data visualization.
🔸 1. NumPy (Numerical Python)
📌 What is NumPy?
NumPy is a foundational Python library for numerical computations. It provides a fast and efficient way to perform operations on arrays and matrices.
Numpy stand for ‘‘Numerical Python’.
It is a package designed for performing numerical data analysis and scientific computations.
NumPy provides a multidimensional array object along with a collection of functions and tools to operate on these arrays.
Since the elements in an array are stored together in memory, they can be accessed quickly and efficiently.
🔹 Key Features:
Multi-dimensional arrays (ndarray)
Mathematical functions: mean, median, standard deviation
Element-wise operations and broadcasting
Fast performance compared to native Python lists
🔹 Example:
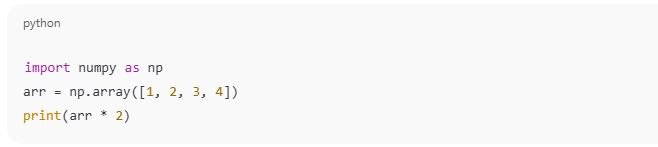
🔹 Use Cases:
Scientific calculations
Machine learning algorithms
Signal processing
🔸 2. Pandas (Python Data Analysis Library)
📌 What is Pandas?
PANDAS (short for PANel DAta) is a powerful data manipulation library used for data analysis. With Pandas, importing and exporting data becomes simple due to its wide range of built-in functions. It is developed on top of libraries like NumPy and Matplotlib, providing a unified and convenient environment for most data analysis and visualization tasks. Pandas offers three key data structures — Series, DataFrame, and Panel — which help make data analysis more structured, effective, and efficient.
Pandas was created by Wes McKinney in 2008.
He developed it while working at a financial company called AQR Capital Management to provide a flexible and powerful tool for data analysis and manipulation using Python.
Pandas is used for working with structured data such as tables, spreadsheets, or databases. It provides two main data structures: Series (1D) and DataFrame (2D).
🔹 Key Features:
Handling missing data
Filtering and sorting
Data aggregation and grouping
Importing and exporting files (CSV, Excel, SQL)
🔹 Example:
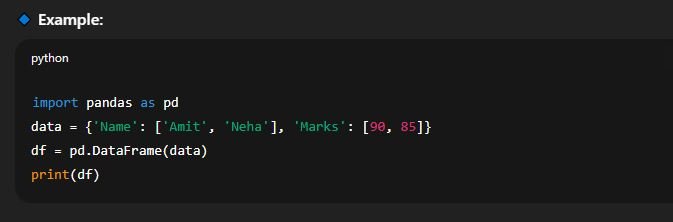
🔹 Use Cases:
Data cleaning
Report generation
Exploratory data analysis (EDA)
🔸 3. Matplotlib
📌 What is Matplotlib?
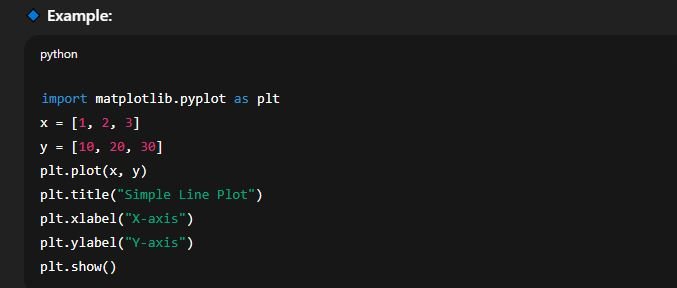
Matplotlib is a powerful library for creating visual representations of data. It allows you to build various types of charts and graphs.
The Matplotlib library in Python is used for creating graphs and visualizations. With just a few lines of code, Matplotlib allows us to produce high-quality plots, histograms, bar graphs, scatter plots, and more. It is built on top of NumPy and is designed to integrate smoothly with both NumPy and Pandas for efficient data visualization.
🔹 Key Features:
Line plots, bar charts, histograms, pie charts
Customizable styles and labels
Saving plots as images (PNG, PDF, etc.)
Integration with Pandas and NumPy
🔹 Use Cases:
Visualizing trends and patterns
Data storytelling
Dashboard and report development
✅ Installing Pandas in a Windows System
You can install the Pandas library on a Windows system using either the Command Prompt or Anaconda. Here are both methods:
🔹 Method 1: Using Command Prompt (with pip)
✅ Requirements: Python must be installed on your system. You can check by typing
python --versionin the Command Prompt.
📌 Steps:
Open Command Prompt.
Type the following command and press Enter:

Wait for the installation to complete. It will automatically install Pandas and its dependencies (like NumPy).
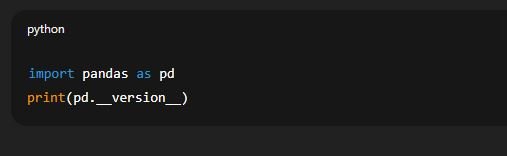
After installation, verify it by opening Python and typing:
🔹 Method 2: Using Anaconda Navigator
✅ Recommended for data science projects as it includes Pandas, NumPy, Matplotlib, and Jupyter by default.
📌 Steps:
Download and install Anaconda from: https://www.anaconda.com
Open Anaconda Navigator.
Launch Jupyter Notebook or Spyder.
Pandas is pre-installed, but you can update it using:
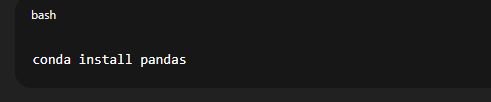
Use
pip install pandasfor quick setup via Command Prompt.
Data Structure in Pandas
Pandas is a powerful Python library used for data analysis and manipulation. It provides two main data structures – Series and DataFrame – and an additional structure called Panel (now deprecated). These structures are built on top of NumPy arrays and are optimized for performance and ease of use.
✅ 1. Series
A Series is a one-dimensional labeled array that can store data of any type – integers, strings, floats, or even Python objects.
A Series consists of two main parts:
Values: The actual data stored.
Index: Labels or identifiers for each data item.
By default, Pandas assigns integer indices starting from 0, but custom indices can also be defined.
📌 Key Features:
Each element in a Series has a label (index).
If no index is provided, default integer indexing is used.
It behaves like both a list and a dictionary.
📌 Example:
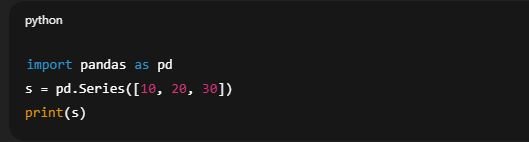
✅ Use Cases:
Storing a single column of data.
Easy mathematical operations and filtering.
Quick lookups by index.
🔹 Ways to Create a Series in Pandas (Brief)
A Series in Pandas is a one-dimensional labeled data structure. It can be created in multiple ways using different data sources. Below are the most common methods:
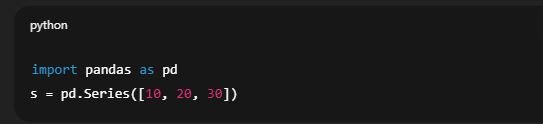
✅ 1. From a List
You can pass a list of values to create a basic Series. Pandas assigns default integer indices starting from 0.
TRY THIS
✅ 2. From a List with Custom Index
You can define custom index labels while creating the Series.

TRY THIS
✅ 3. From a Dictionary
When using a dictionary, keys become the index and values become the data

TRY THIS
✅ 4. From a Scalar Value
A single value can be repeated for each index provided.

TRY THIS
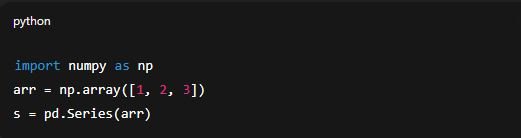
✅ 5. From a NumPy Array
You can convert a NumPy array into a Series.
TRY THIS
Accessing Elements of a Series
Elements of a Series can be accessed mainly in two ways: Indexing and Slicing.
(A) Indexing
Indexing in a Series works similarly to NumPy arrays and helps in retrieving elements. There are two types of indexes: positional and labelled. Positional index uses an integer that represents the element’s position starting from 0, while labelled index uses any custom label defined by the user.
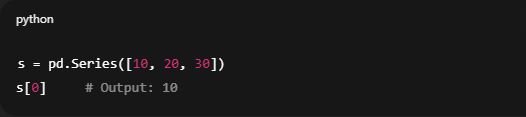
✅ 1. By Position
Use numeric index like in lists.
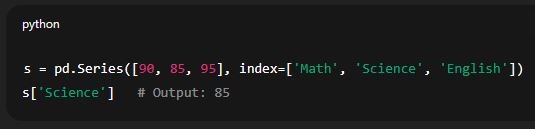
✅ 2. By Label
Use custom index labels if defined.
(B) Slicing
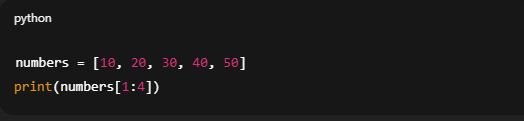
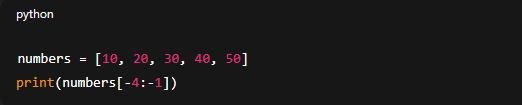
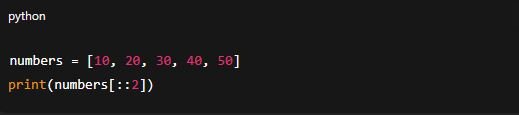
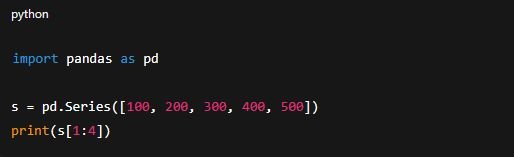
At times, we may want to retrieve a portion of a Series. This can be achieved using slicing, which works similarly to slicing in NumPy arrays. To slice a Series, we specify the start and end values in the format [start:end] along with the Series name. While using positional indices, the element at the end index is not included, meaning only (end – start) number of items from the Series are fetched.

🟦 1. Basic Slicing on a List
🟦 2. Slicing with Omitted Start Index
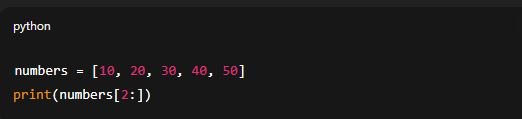
🟦 3. Slicing with Omitted End Index
🟦 4. Slicing with Negative Indices
🟦 5. Slicing with Step Value
🟦 6. Slicing a Pandas Series
TRY THIS
✅ Attributes of a Pandas Series
Pandas Series objects come with several built-in attributes that help in understanding and managing the data effectively.
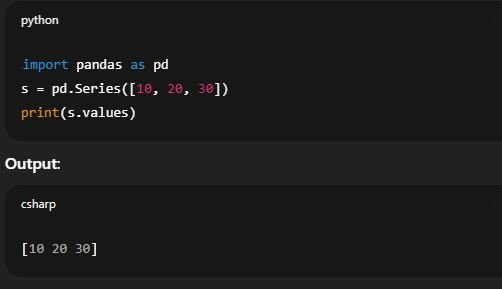
🔹 1. values
Purpose: Returns the underlying data of the Series in the form of a NumPy array.
Type:
ndarrayUsage:
TRY THIS
🔹 2. index
Purpose: Displays the index (labels) assigned to the Series elements.
Type:
IndexobjectUsage:
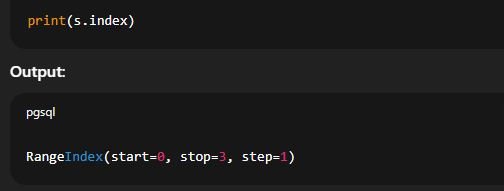
Explanation: By default, the index starts from 0 and increases sequentially unless explicitly changed.
🔹 3. dtype (Data Type)
Purpose: Shows the data type of the elements stored in the Series.
Type:
dtypeobjectUsage:
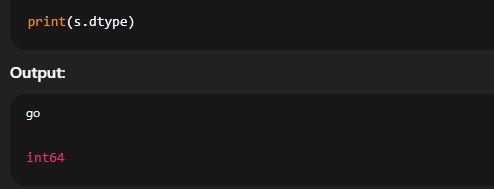
Explanation: Helps in understanding the type of data (e.g., int, float, object) for further processing.
🔹 4. size
Purpose: Returns the total number of elements in the Series.
Type:
intUsage:
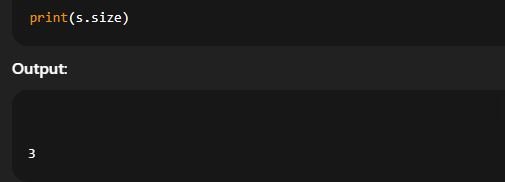
Explanation: Useful for checking the Series length regardless of index labels.
🔹 5. shape
Purpose: Returns a tuple representing the dimensional structure of the Series.
Type:
tupleUsage:
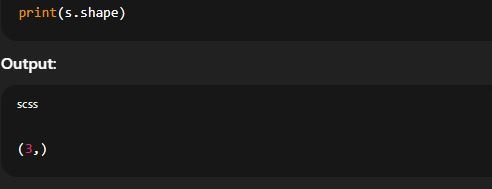
Explanation: It confirms that the Series is one-dimensional and shows how many elements it contains.
🔹 6. ndim
Purpose: Tells the number of dimensions in the Series.
Type:
intUsage:
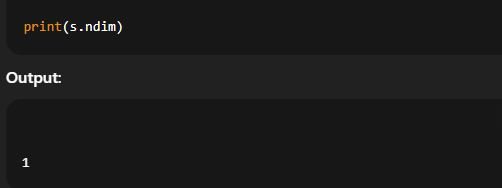
Explanation: Series is always one-dimensional, so this value is always 1.
🔹 7. name
Purpose: Returns or sets the name of the Series.
Type:
strorNoneUsage:
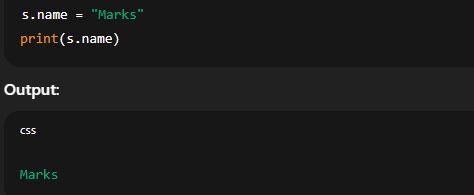
Explanation: Helpful when the Series is a column in a DataFrame or used in data visualization.
🔹 8. hasnans
Purpose: Indicates if the Series contains any missing (
NaN) values.Type:
boolUsage:
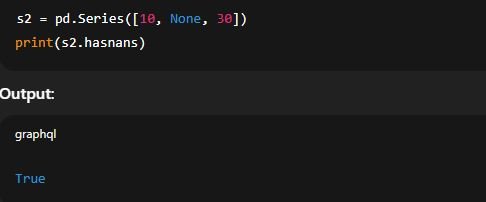
Explanation: A quick way to detect if data cleaning is needed.
🔹 9. empty
Purpose: Checks if the Series has no elements.
Type:
boolUsage:
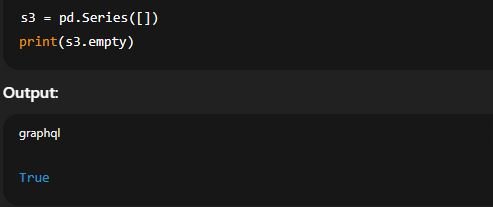
Explanation: Useful before performing operations to avoid errors on empty Series.
Attributes of Pandas Series
| Attribute | Description | Example Value |
|---|---|---|
| values | Returns Series elements as array | [10, 20, 30] |
| index | Displays Series index | RangeIndex(0, 3) |
| dtype | Data type of elements | int64 |
| size | Number of elements | 3 |
| shape | Dimensions in tuple format | (3,) |
| ndim | Number of dimensions (always 1) | 1 |
| name | Name of the Series | "Marks" |
| hasnans | Checks for NaN values | True / False |
| empty | Checks if Series is empty | True / False |
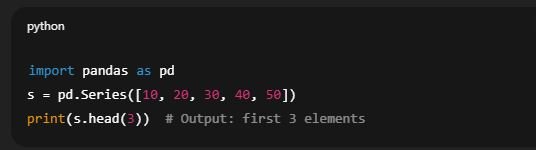
1. head(n)
Returns the first n elements of the Series. Useful for quickly viewing top entries.
Example: s.head(3) → shows first 3 elements.
Displays the first n elements of the Series. If n is not provided, it defaults to 5 and shows the first five elements.
2. tail(n)
Returns the last n elements of the Series.
Displays the last n elements of the Series. If n is not given, it defaults to 5 and shows the last five elements.
Example: s.tail(2) → shows last 2 elements.

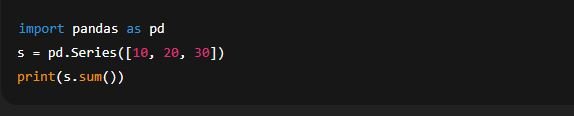
3. sum()
Calculates the total sum of all numeric values in the Series.
The sum() function in Pandas is used to calculate the total or sum of values along a specified axis in a Series or DataFrame.
➤ For Series:
When applied to a Pandas Series, sum() returns the total of all numeric values in the Series.
Example: s.sum() → returns the sum of all items.
4. mean()
Returns the average (arithmetic mean) of numeric values.
The mean() function in Pandas is used to calculate the average (arithmetic mean) of numeric data in a Series or DataFrame.
➤ For Series:
When applied to a Pandas Series, mean() returns the average of all numeric values.
Example: s.mean() → returns average value.

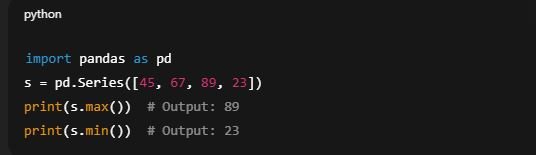
5. max() / min()
Finds the highest or lowest value in the Series.
The max() and min() functions in Pandas are used to find the maximum and minimum values in a Series or DataFrame.
➤ For Series:
max()returns the highest value.min()returns the lowest value.
Example:
s.max()→ maximum values.min()→ minimum value
6. value_counts()
Shows the frequency of each unique value in the Series.
The value_counts() function in Pandas is used to count the frequency of unique values in a Series. It returns a Series containing counts of unique values in descending order.
➤ For Series:
It helps in analyzing categorical data by showing how many times each value appears.
Syntax:
Example: s.value_counts() → returns a count of all distinct values.

7. unique()
Returns a list of all unique values in the Series.
The unique() function in Pandas is used to retrieve all unique values from a Series. It returns the distinct elements present in the Series, in the order of their appearance.
➤ Syntax:
Series.unique()Example: s.unique() → shows unique items.

8. sort_values()
Sorts the Series values in ascending order (default).
The sort_values() function in Pandas is used to sort data in a Series or DataFrame by the values of one or more columns.
It sorts the values in ascending or descending order.
➤ Syntax:
Example: s.sort_values() → sorts values in increasing order.

9. sort_index()
Sorts the Series based on its index labels.
The sort_index() function in Pandas is used to sort a Series or DataFrame based on its index labels, not its values.
It sorts the index of a Series in ascending or descending order.
Example: s.sort_index() → sorts data using index.

10. isnull() / notnull()
Checks for missing values (NaN) and returns a Boolean Series.
The functions isnull() and notnull() in Pandas are used to identify missing (null/NaN) values in a Series or DataFrame.
Returns
Truefor missing (NaN) values.Returns
Falsefor all other (non-missing) values.
s.isnull()→ True for nullss.notnull()→ True for non-nulls

11. fillna(value)
Replaces missing values (NaN) with the specified value.
To fill or replace NaN (null) values so that the data becomes complete and can be processed or analyzed without errors.
Example: s.fillna(0) → replaces all NaNs with 0.

Mathematical Operations on Series.
Pandas Series supports element-wise mathematical operations. These operations are performed between Series objects or between a Series and a scalar (single number). Pandas automatically aligns data by index, making operations flexible and powerful.
When you perform mathematical operations between two Pandas Series, the operations are carried out element by element, based on matching indexes. This is also known as vectorized operations.
1. Addition (+)
Adds values in the Series either with another Series or a scalar.