Microsoft Excel is a powerful spreadsheet application developed by Microsoft, widely used for data analysis, financial calculations, and project management.
It provides an easy-to-use interface combined with robust features for organizing, analyzing, and visualizing data.
1. Understanding the Excel Interface
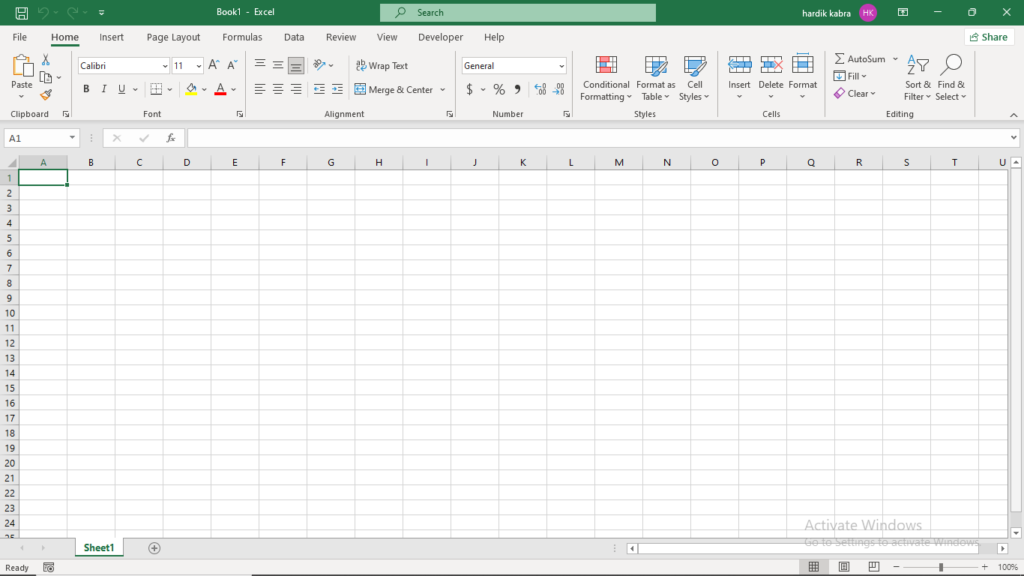
When you open Excel, you are greeted with a blank workbook containing worksheets.
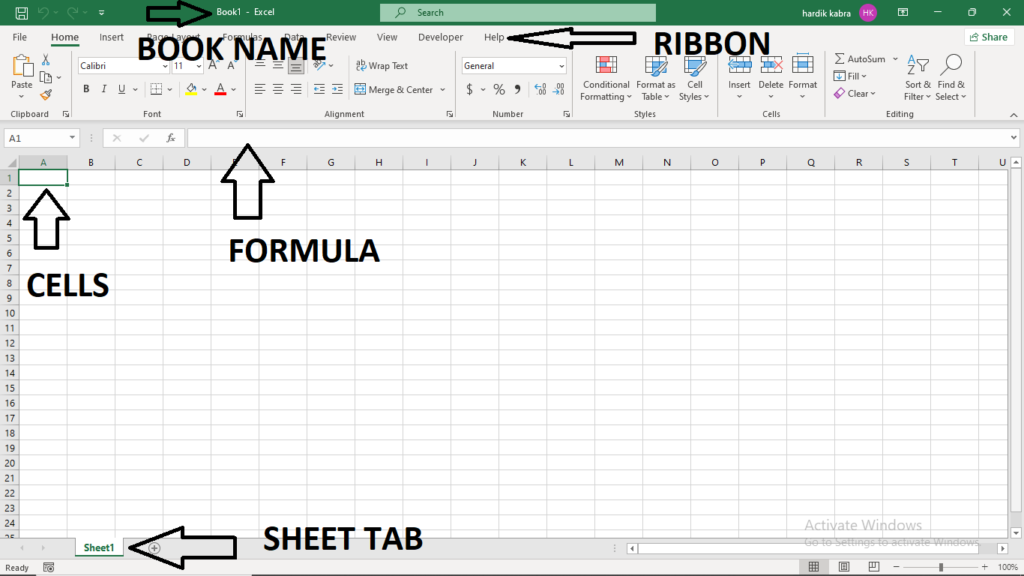
The key components of the Excel interface include:
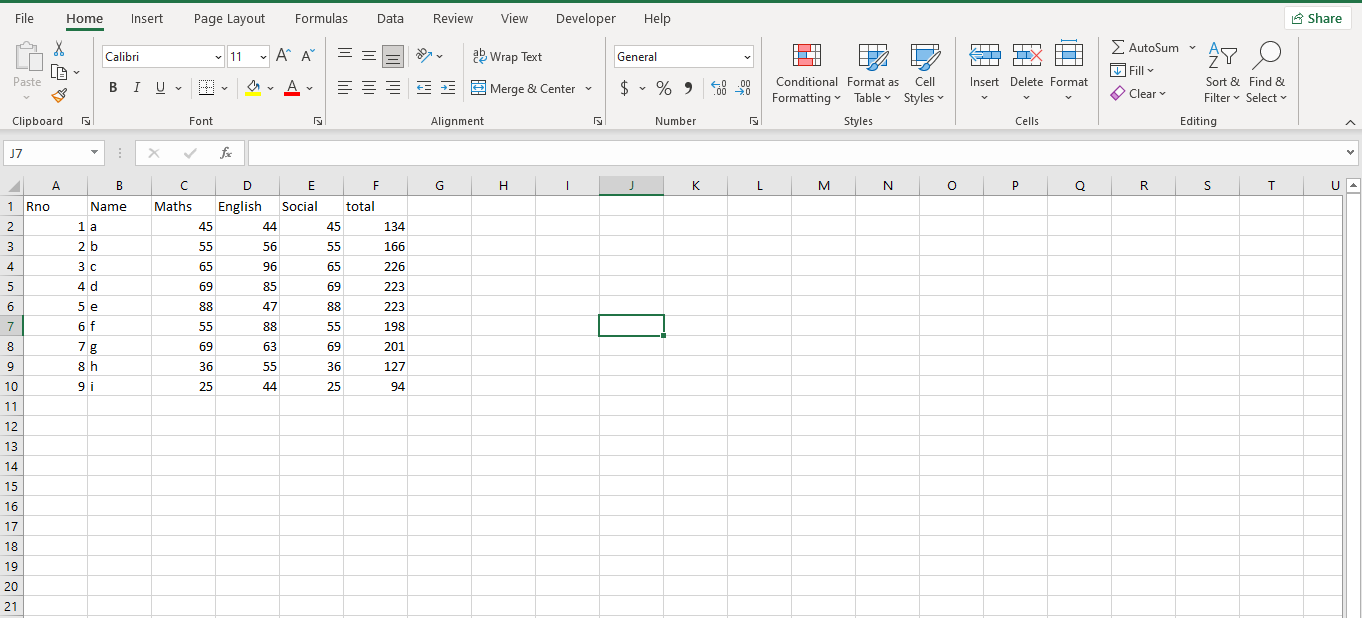
Ribbon: The toolbar at the top that contains different tabs such as Home, Insert, Page Layout, Formulas, Data, Review, and View.
Worksheet: A grid made up of rows and columns where data is entered.
Cells: Individual boxes where data, numbers, or formulas can be input.
Formula Bar: Displays the content or formula of a selected cell.
Name Box: Shows the address of the currently selected cell.
Sheet Tabs: Located at the bottom, allowing users to navigate between multiple worksheets in a workbook.
2. Basic Operations in Excel
Before diving into complex functions, it’s essential to understand the basic operations in Excel:
Entering Data: Click on a cell and type text, numbers, or formulas.
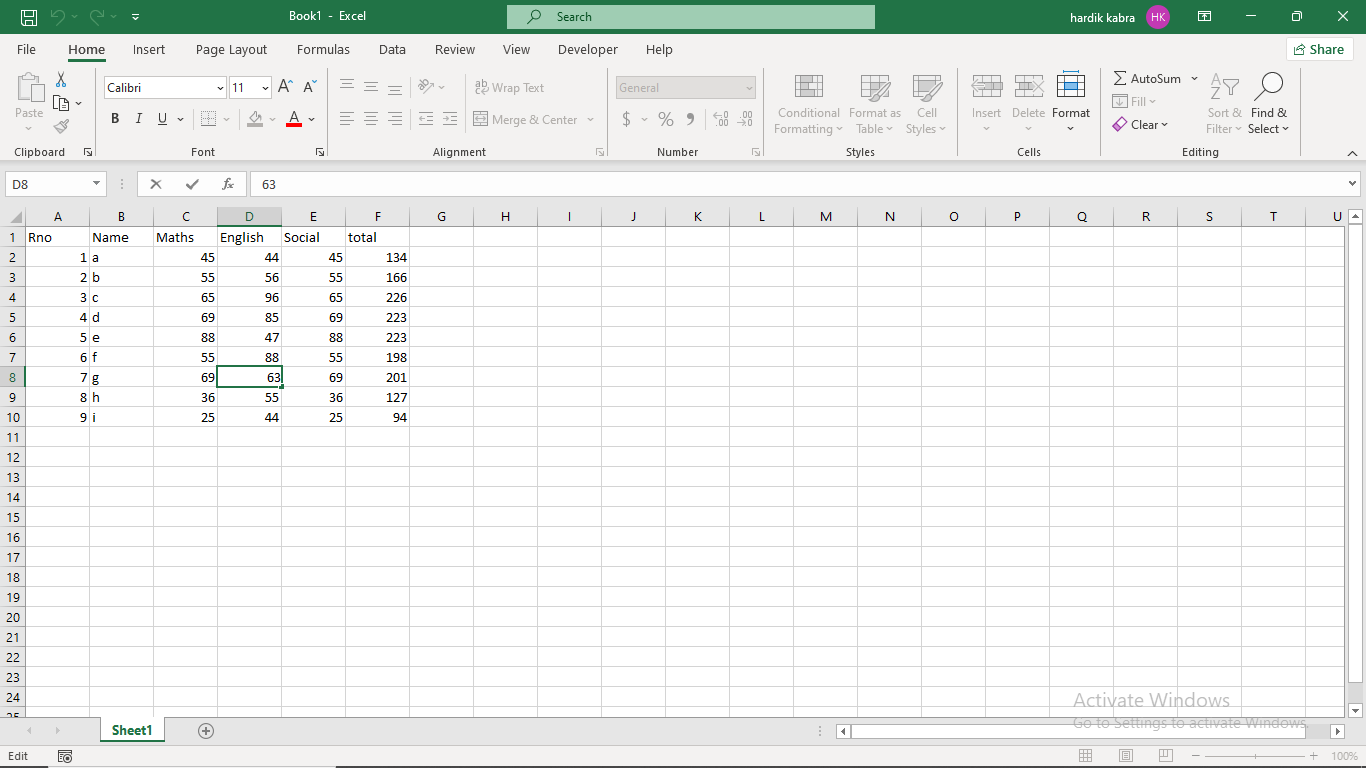
Editing Data: Double-click a cell to modify its content or edit directly from the formula bar.
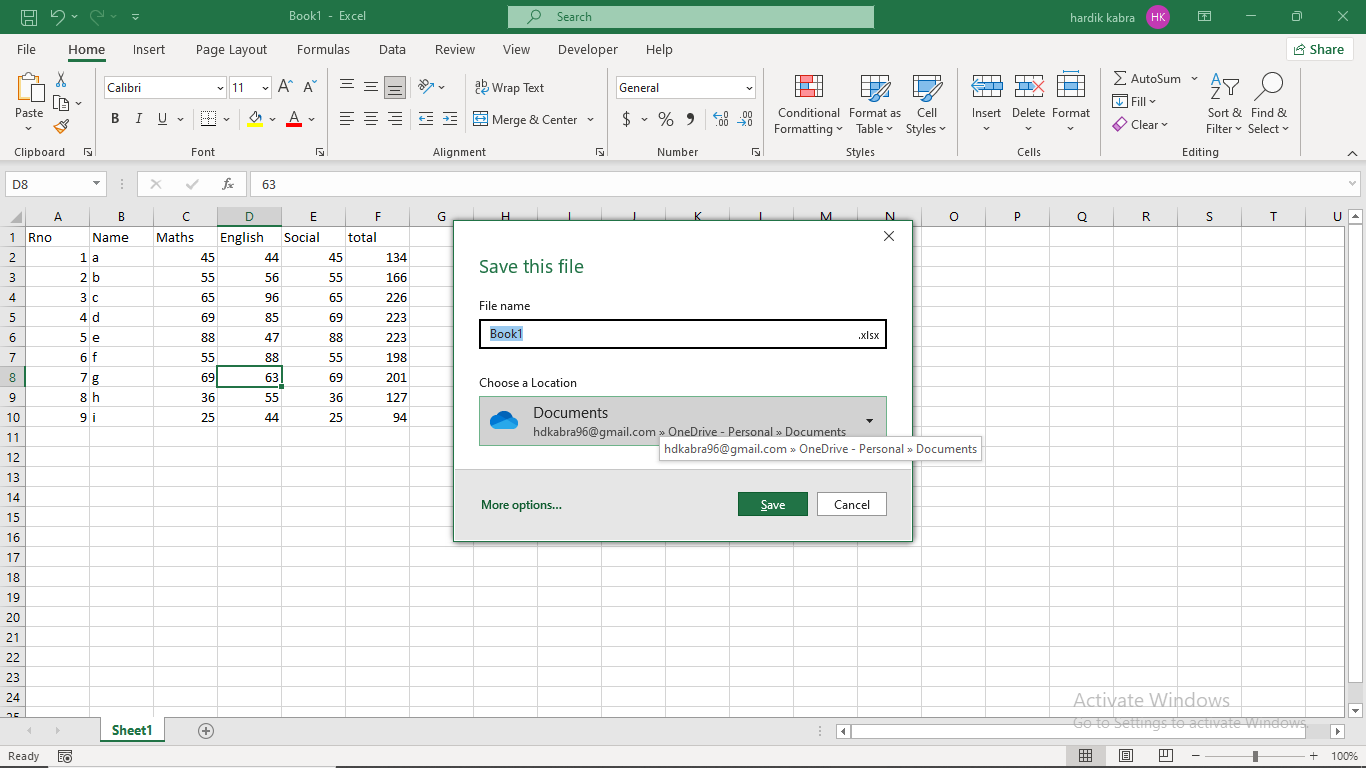
Saving a Workbook: Click File > Save As and choose a location and file format (.xlsx, .csv, etc.).
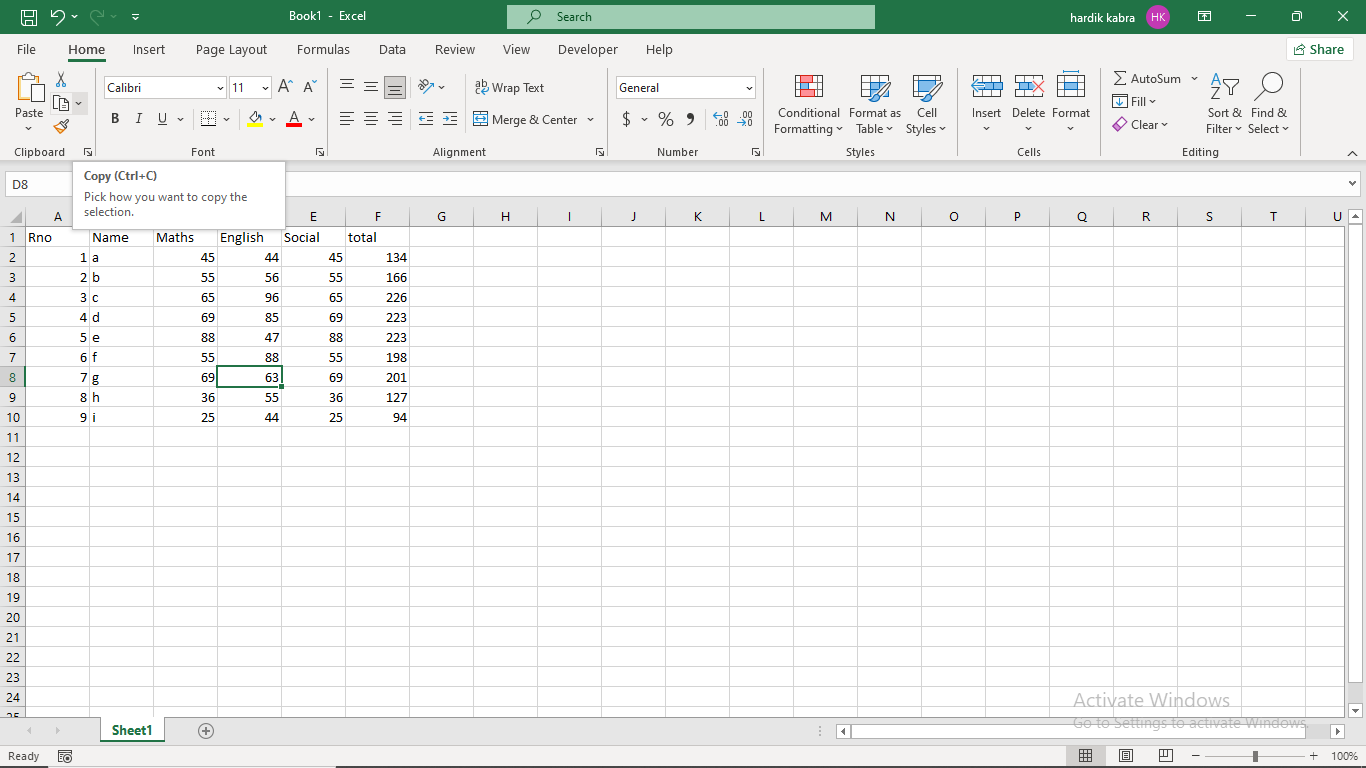
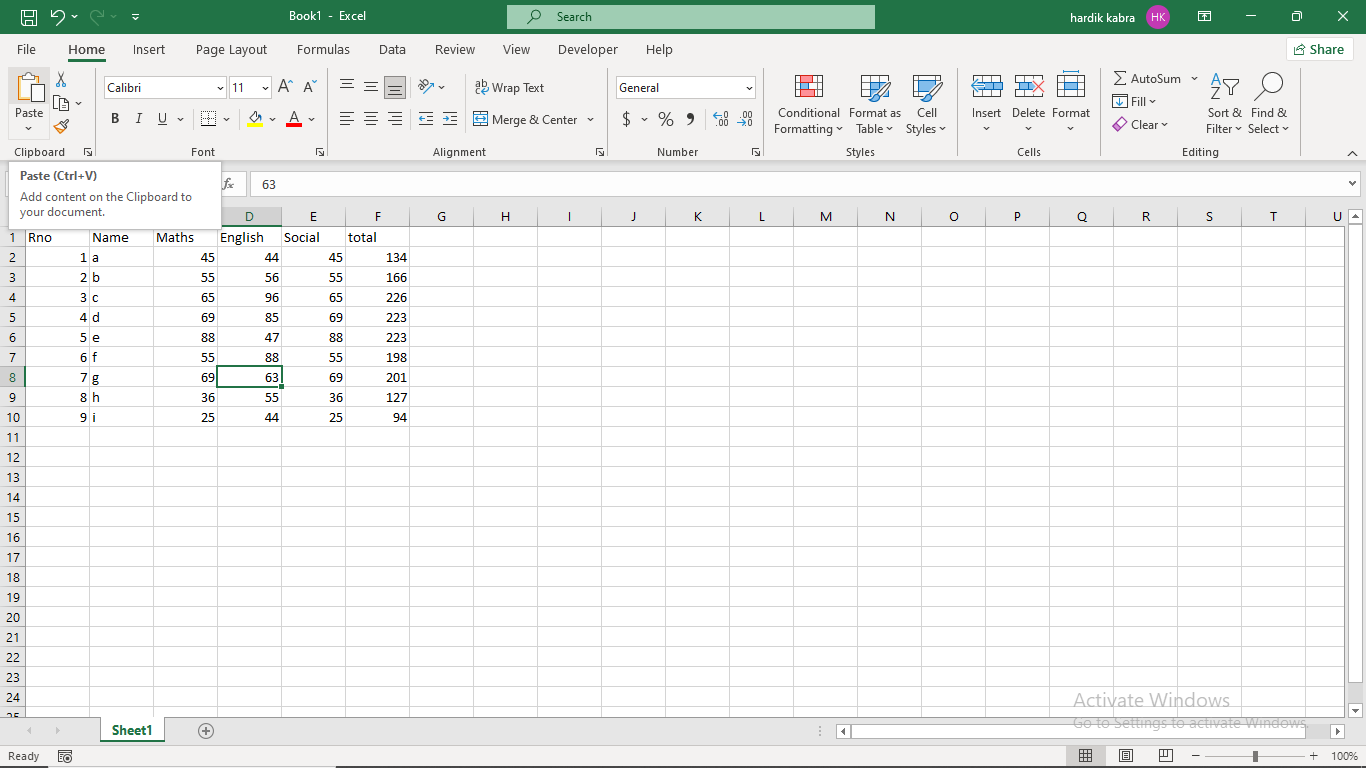
Copying and Pasting Data: Use Ctrl + C to copy and Ctrl + V to paste data.
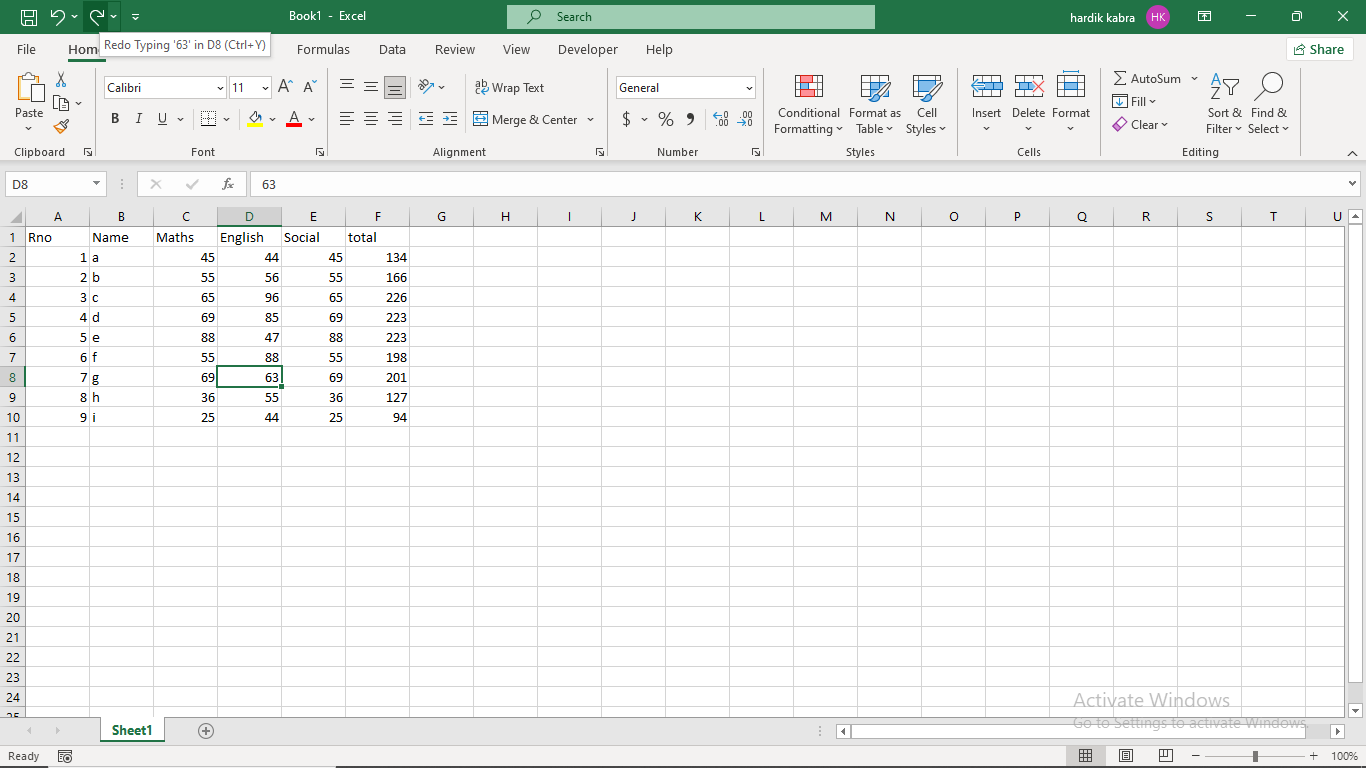
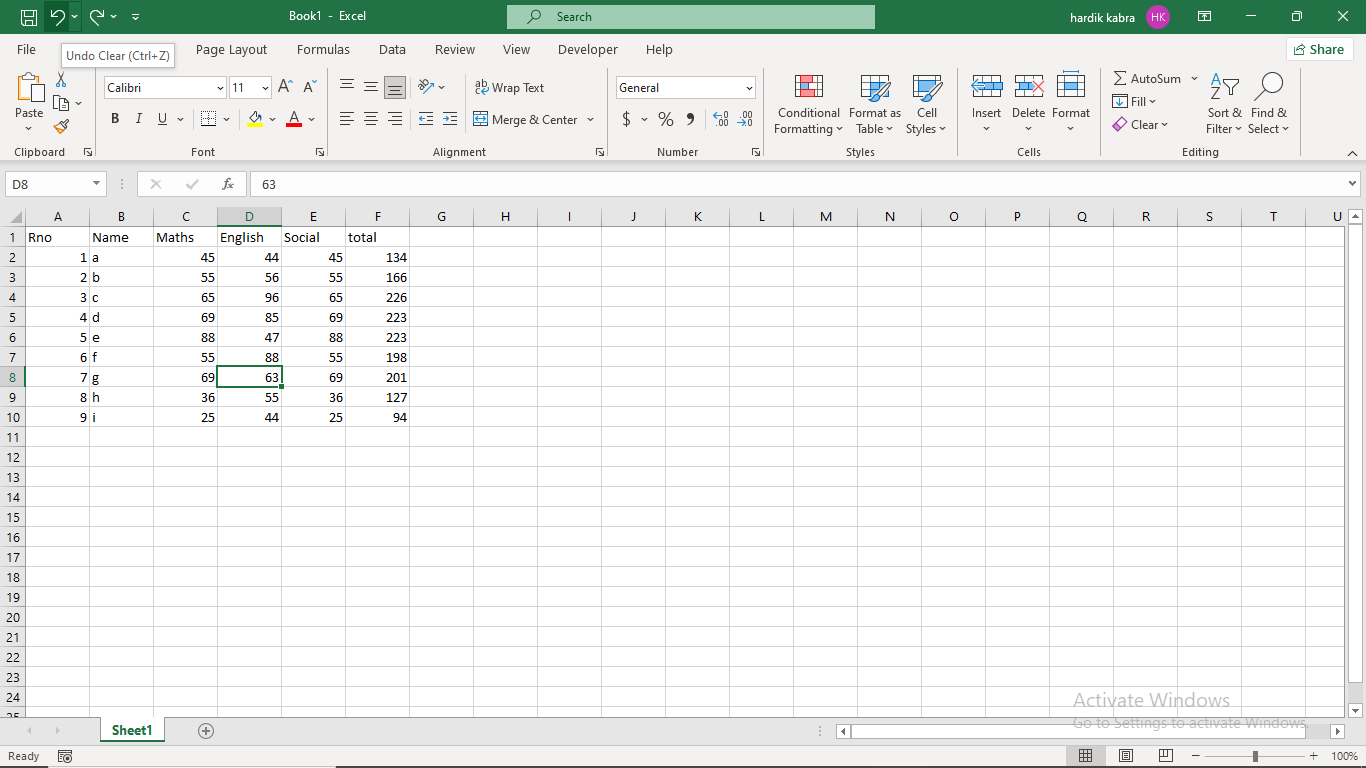
Undo and Redo: Use Ctrl + Z to undo and Ctrl + Y to redo an action.
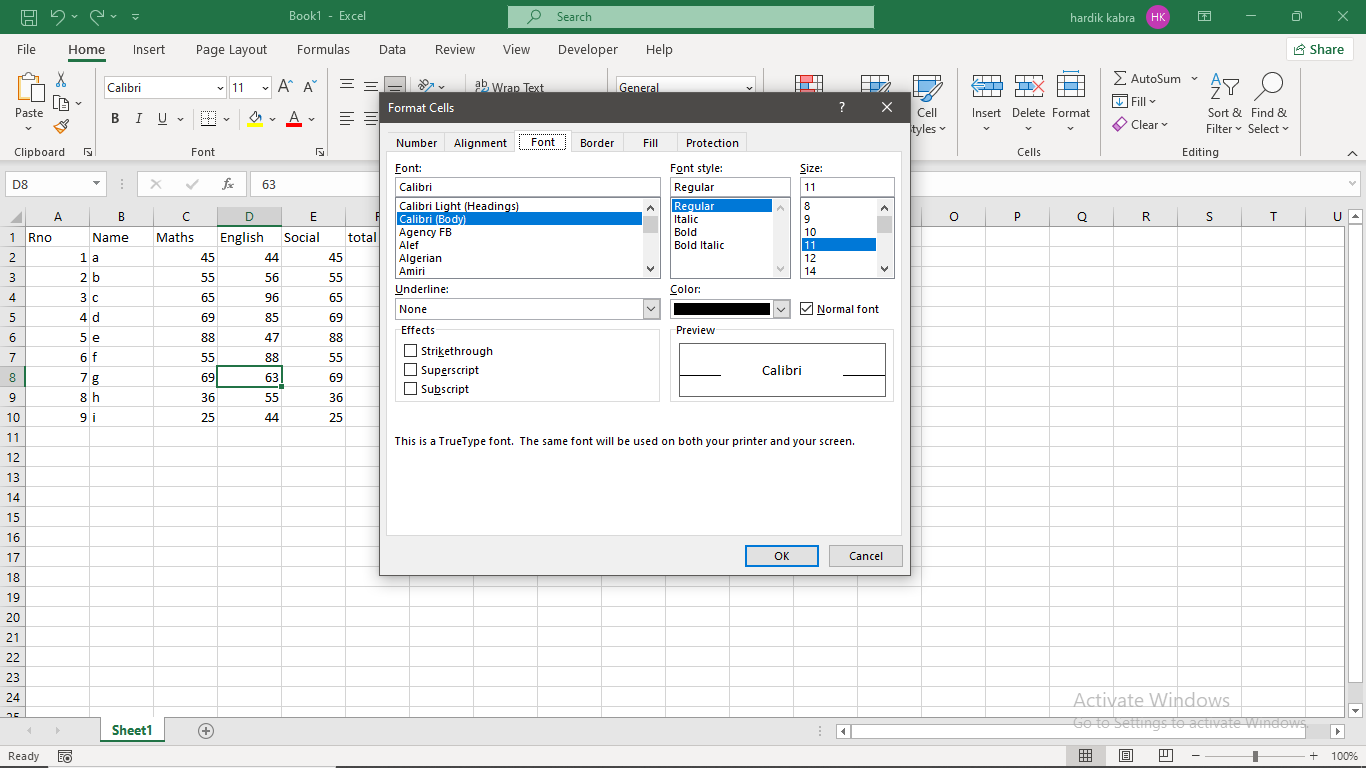
Formatting Cells: Change font, color, alignment, and number format using the Home tab.
3. Working with Formulas and Functions
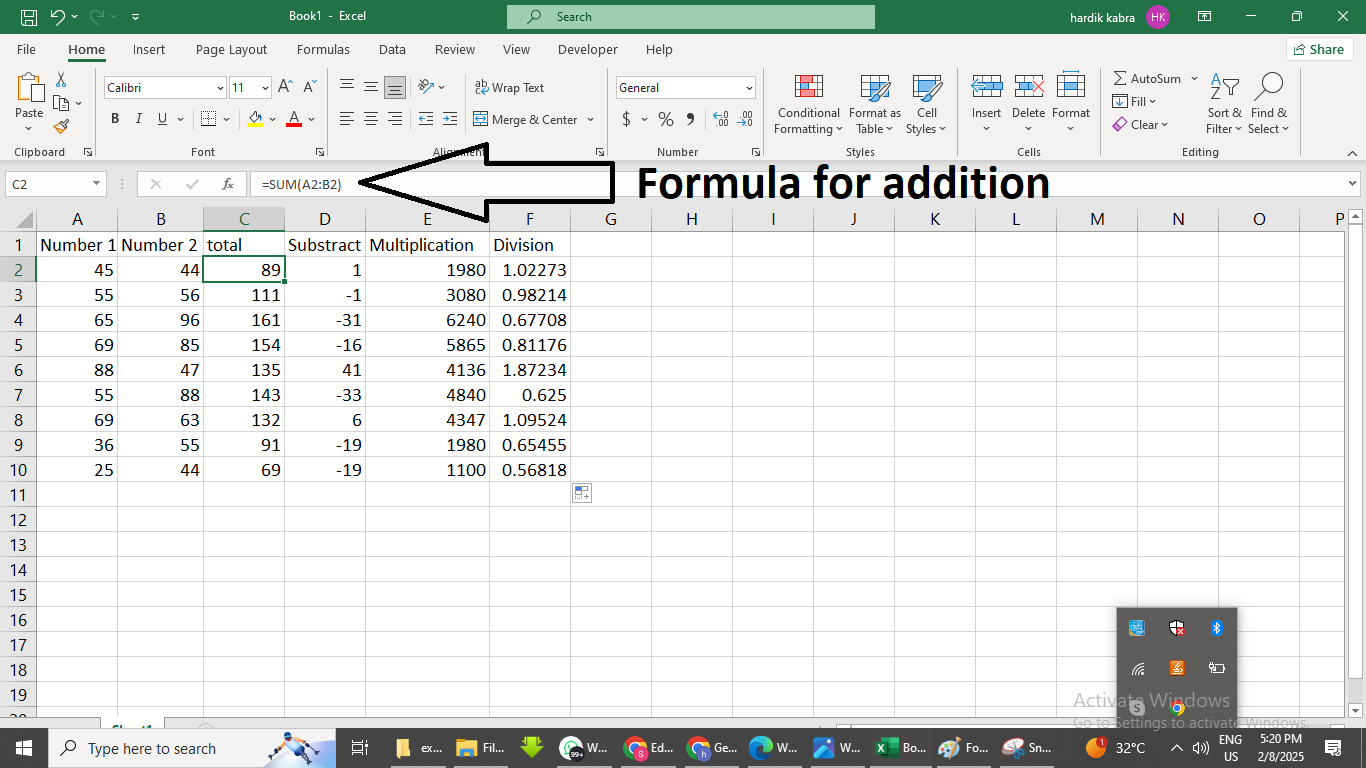
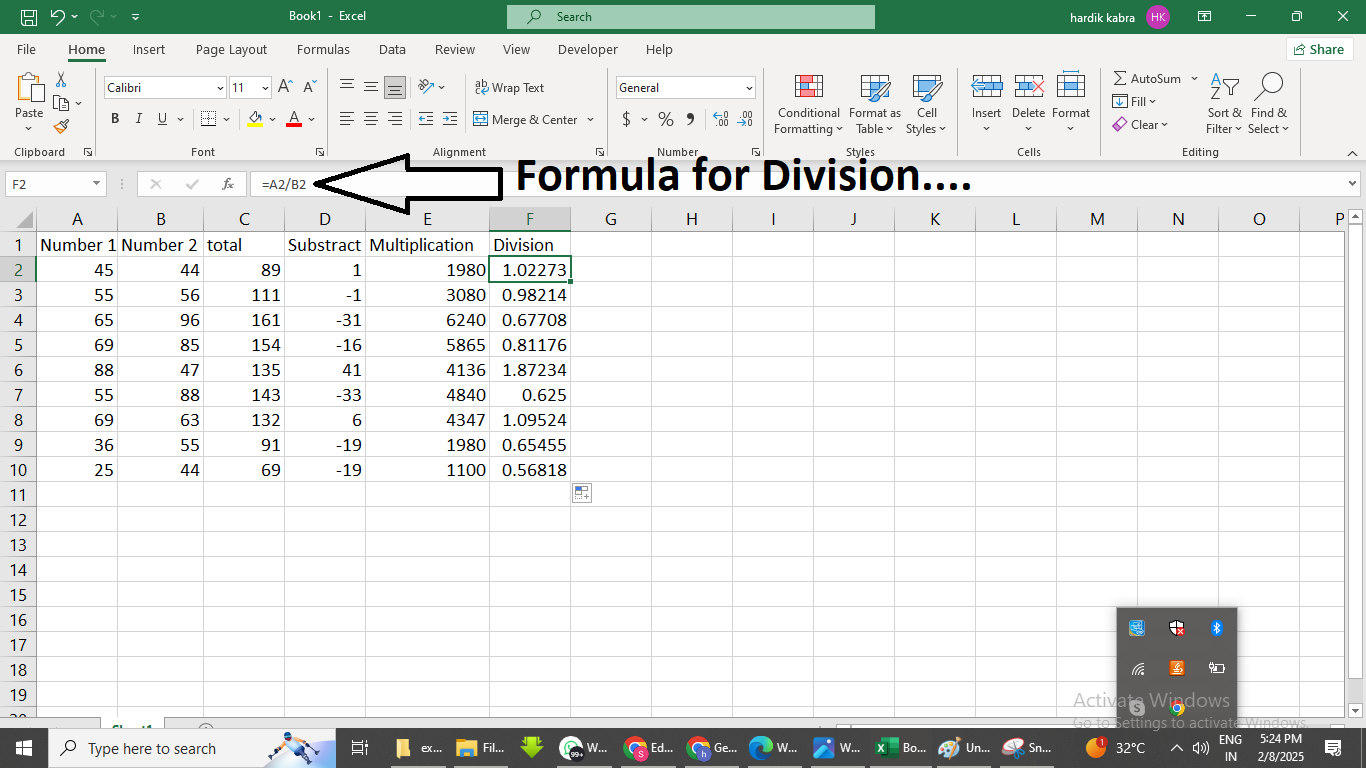
Excel allows users to perform calculations using formulas and built-in functions. Some basic formulas include:
Addition: =A1 + B1
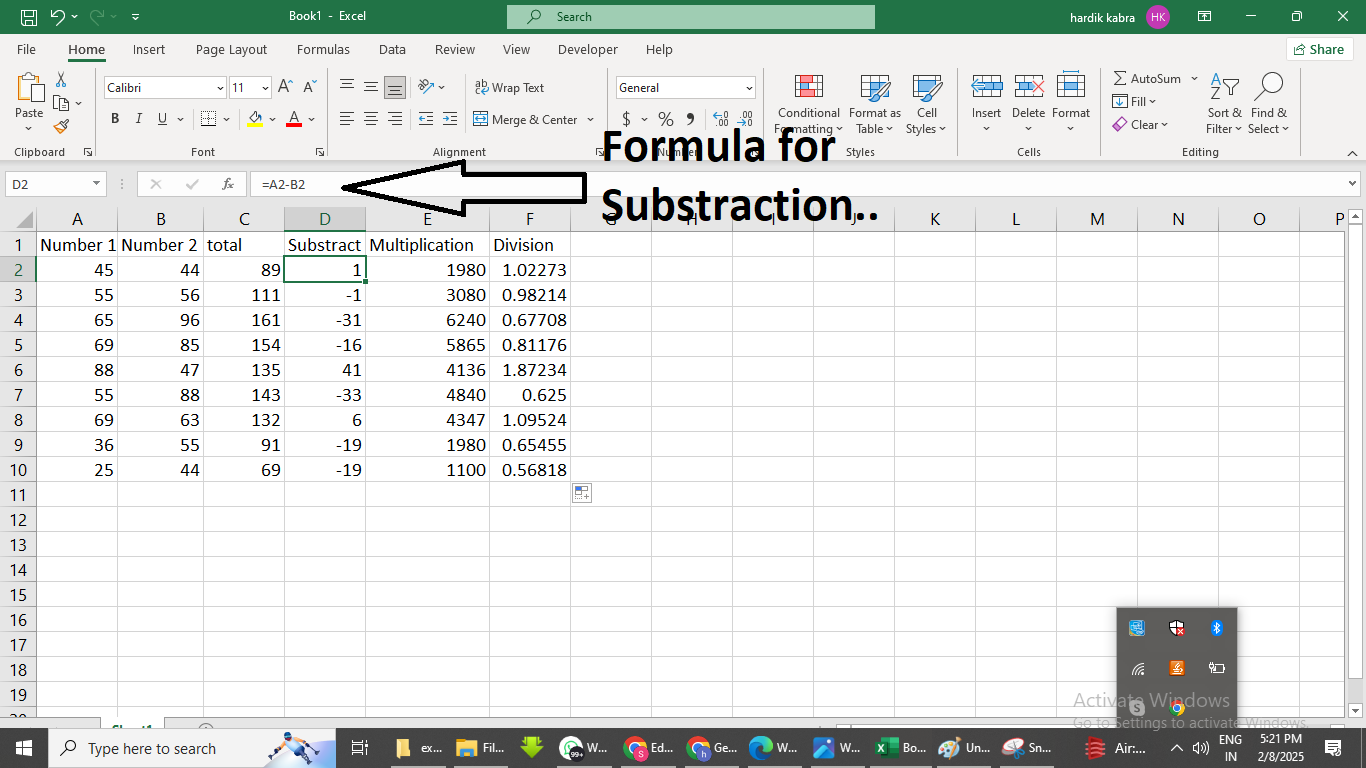
Subtraction: =A1 - B1
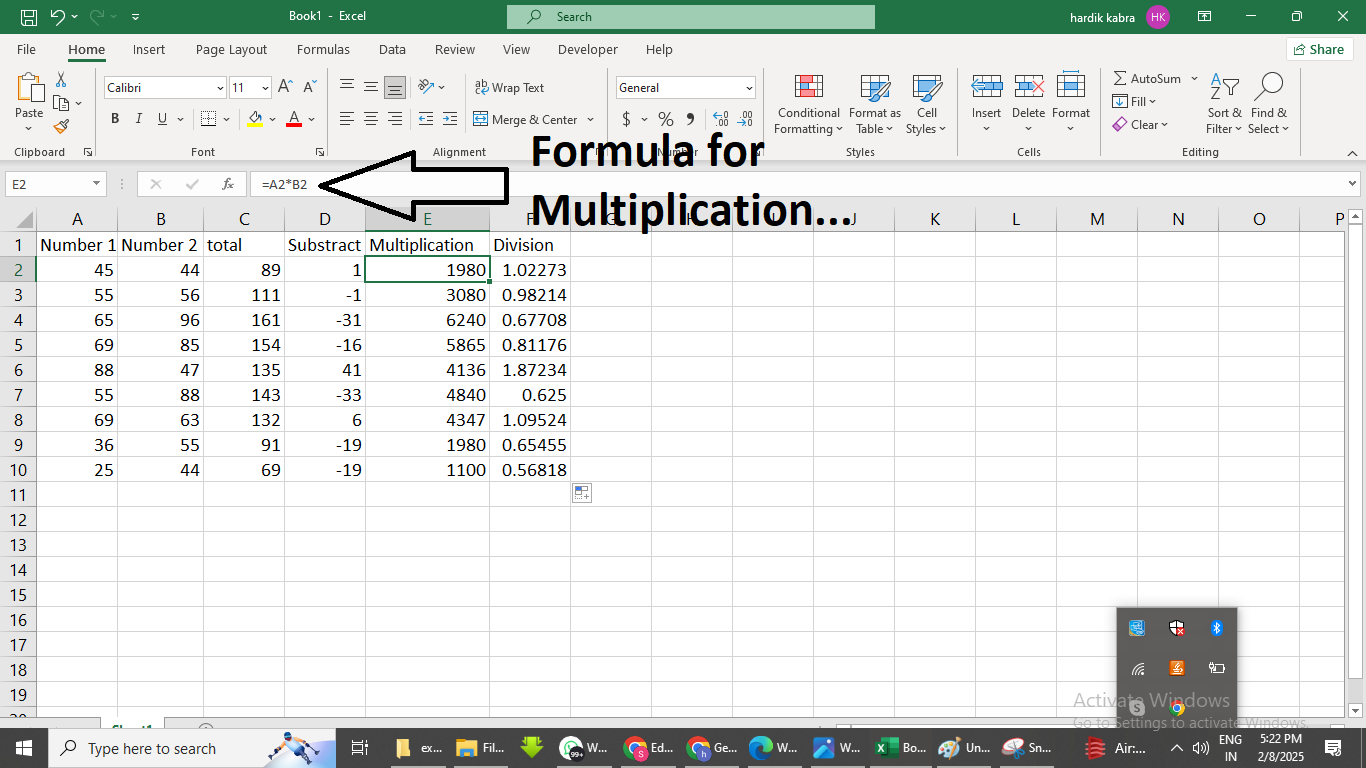
Multiplication: =A1 * B1
Division: =A1 / B1
Common functions include:
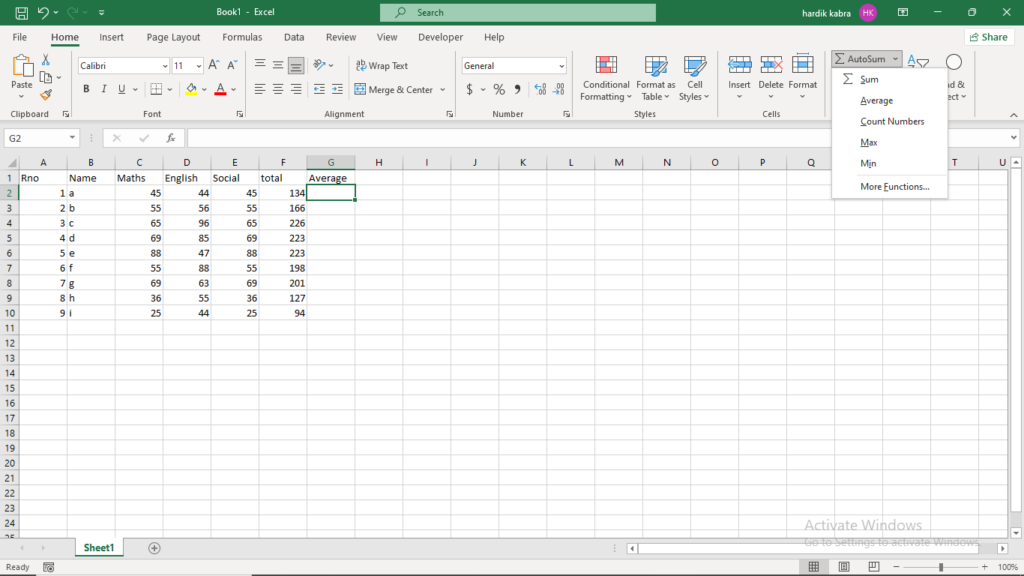
SUM: =SUM(A1:A10) (Adds values in the given range)
AVERAGE: =AVERAGE(A1:A10) (Calculates the mean of values)
IF: =IF(A1>10, "High", "Low") (Returns a value based on a condition)
VLOOKUP: =VLOOKUP(lookup_value, table_array, col_index, [range_lookup]) (Finds a value in a table)
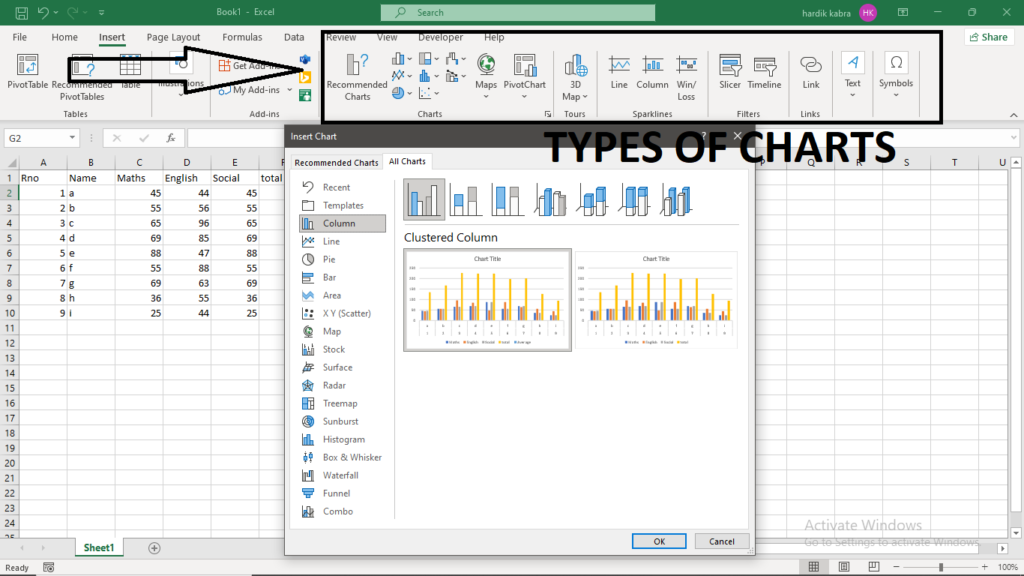
Excel allows users to create visual representations of data using various chart types:
Bar Chart: Useful for comparing categories.
Line Chart: Shows trends over time.
Pie Chart: Represents proportions.
Scatter Plot: Displays relationships between variables.
Pivot Charts: Summarizes large datasets.
To create a chart, select the data range and go to Insert > Charts to choose a suitable chart type.
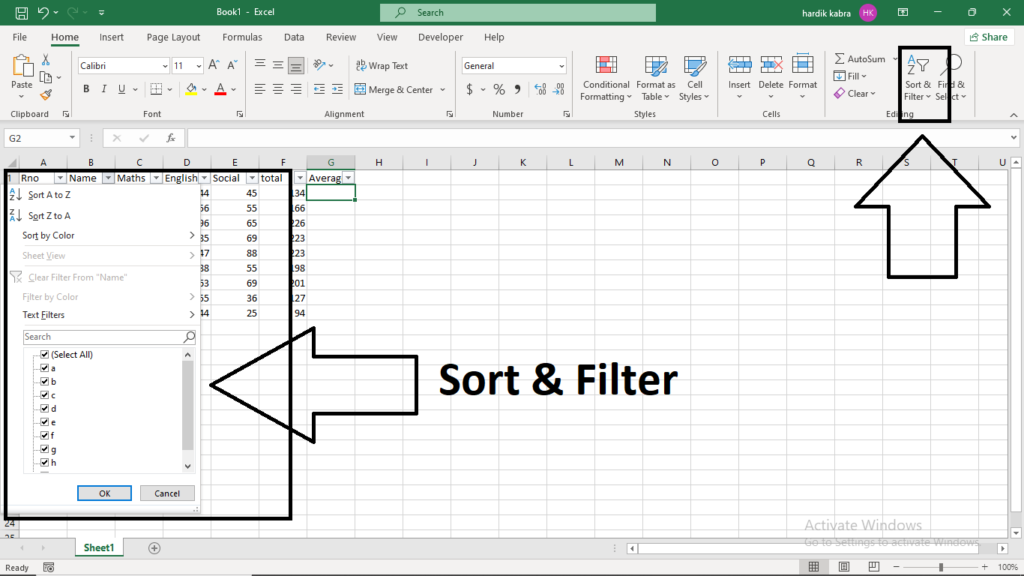
5. Sorting and Filtering Data.
Sorting and filtering help manage large datasets efficiently:
Sorting: Arrange data in ascending or descending order by selecting the column and using Sort & Filter from the Home tab.
Filtering: Display specific data by applying filters using Data > Filter.
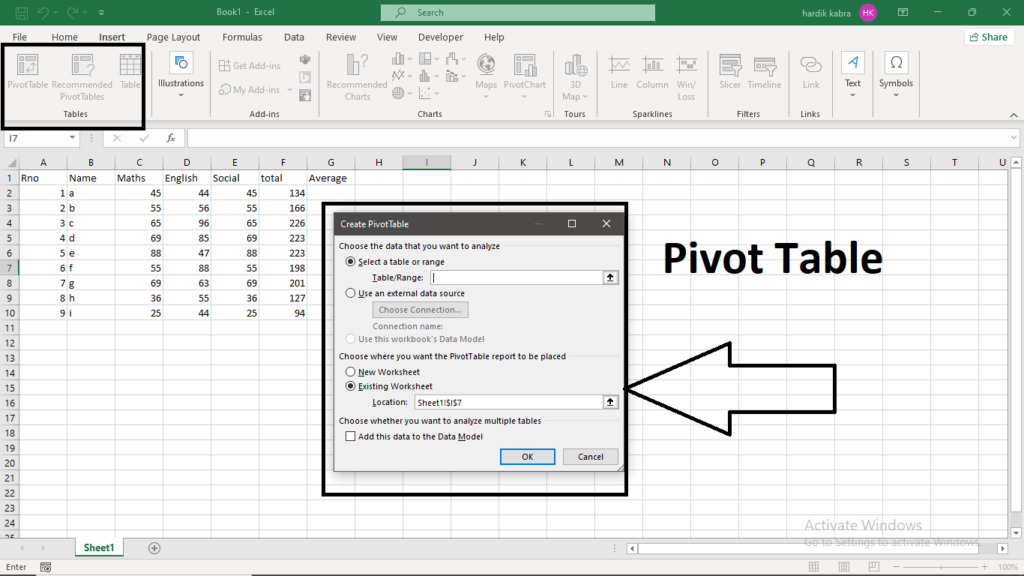
6. Introduction to Pivot Tables.
Pivot tables are powerful tools for summarizing and analyzing large datasets. To create a pivot table:
Select the data range.
Go to Insert > PivotTable.
Choose the fields to analyze and drag them into the required sections.
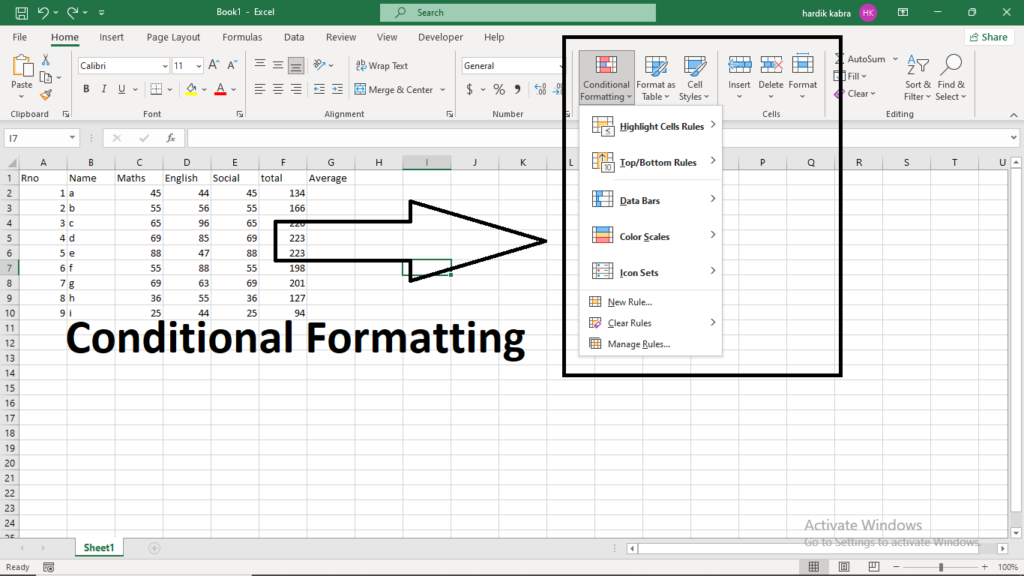
7. Conditional Formatting.
Conditional formatting highlights data based on specific conditions:
Select the range.
Go to Home > Conditional Formatting.
Choose rules such as highlighting cells above a certain value, using color scales, or applying data bars.
8. Using Excel Shortcuts.
Using keyboard shortcuts can improve efficiency in Excel:
Ctrl + N: New workbook
Ctrl + S: Save workbook
Ctrl + P: Print workbook
Ctrl + Shift + L: Toggle filters
Ctrl + Arrow Keys: Navigate large datasets
Ctrl + Space: Select an entire column
Shift + Space: Select an entire row
Conclusion
Microsoft Excel is a versatile tool for handling data efficiently. Mastering its fundamental features, formulas, and visualization techniques can significantly enhance productivity.
As you become more familiar with Excel, you can explore advanced functionalities such as macros, data analysis tools, and automation using VBA.
By practicing regularly and exploring different functions, you can make the most of Excel’s capabilities for personal and professional use.