import matplotlib.pyplot as plt
import numpy as np

# DATA
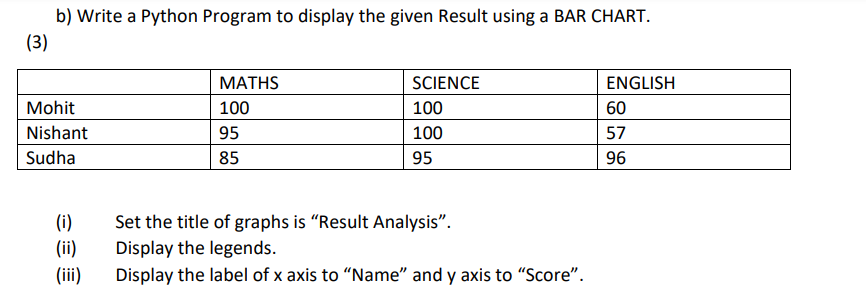
student = ['Mohit','Nishant','Sudha']
subjects = ['Maths','Science','English']
marks = [
        [100,100,60],
        [95,100,57],
        [85,95,96]]
x = np.arange(len(subjects)) #[0,1,2]
# Bar width

bar_width = 0.25

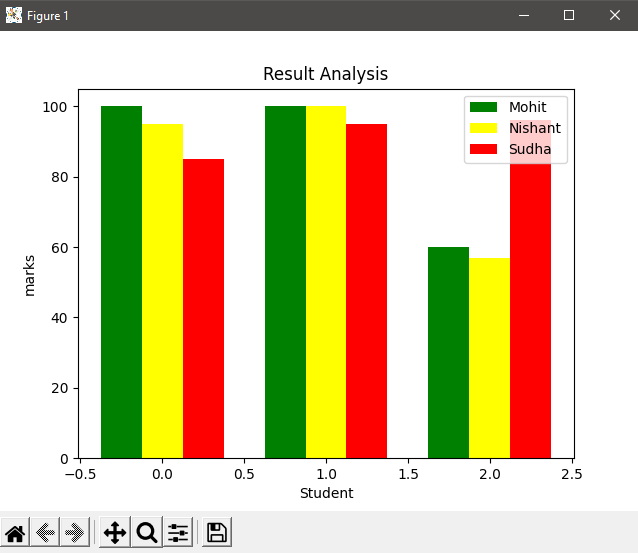
# Creating a bar Chart
plt.bar(x - bar_width,marks[0],width = bar_width , label='Mohit',color='green')
plt.bar(x, marks[1] , width=bar_width , label='Nishant',color='yellow')
plt.bar(x + bar_width , marks[2] , width=bar_width , label='Sudha',color='red')

plt.xlabel('Student')
plt.ylabel('marks')
plt.title('Result Analysis')
plt.legend()

plt.show()
Your email address will not be published. Required fields are marked *
Comment *
Name *
Email *
Website
Save my name, email, and website in this browser for the next time I comment.
© Copyright CODEMANIAC STUDIO ™